
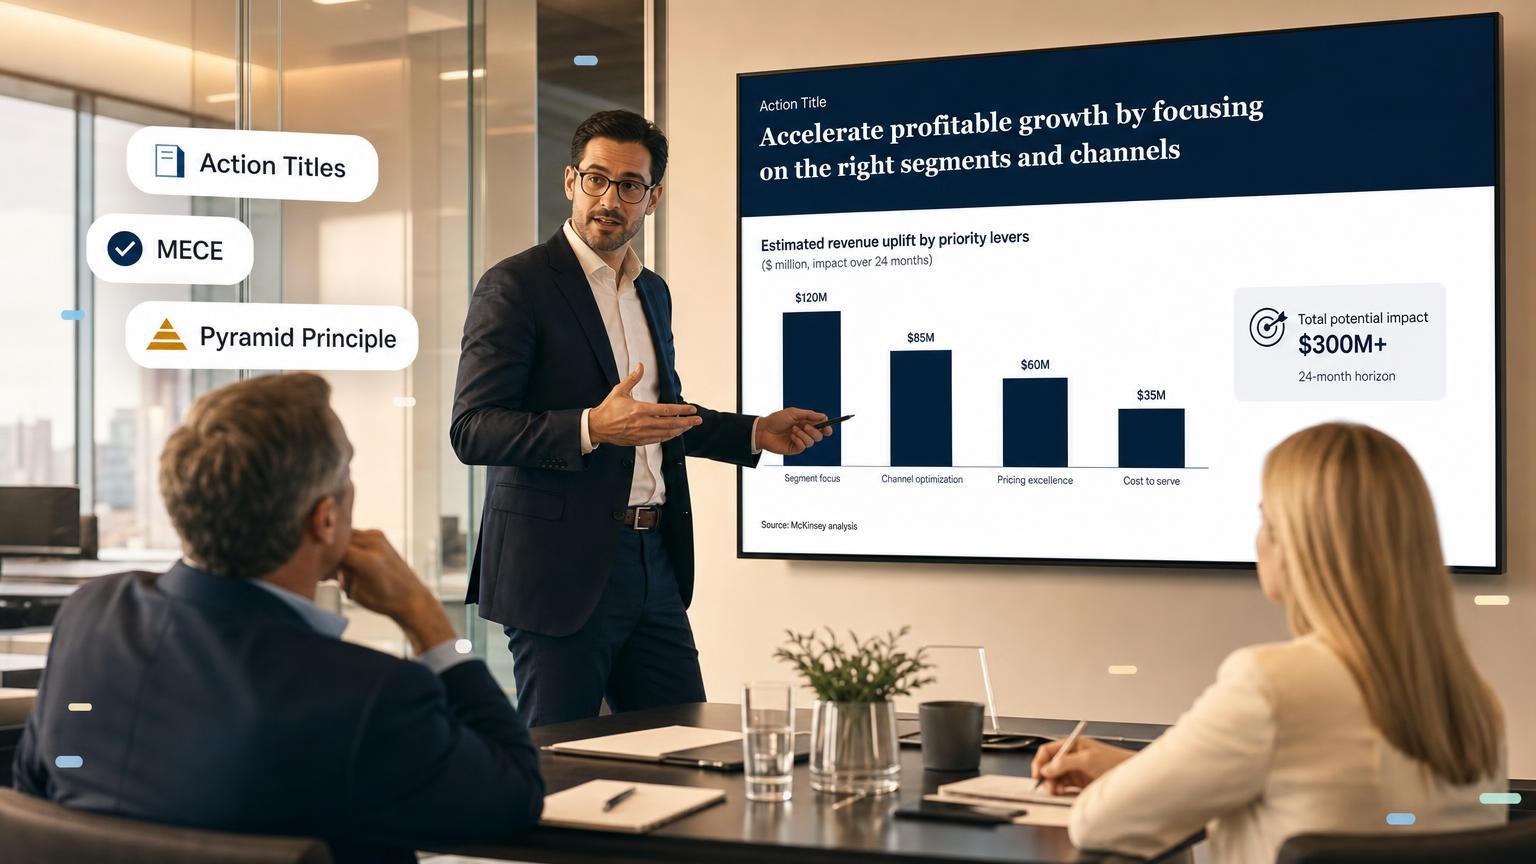
McKinsey slides follow three rules. The recommendation comes first, every slide title is a full-sentence action title, and each slide proves one message with one exhibit and a source line.
The structure comes from Barbara Minto's Pyramid Principle, which she developed at McKinsey in the 1960s and early 1970s. A McKinsey slide deck has five parts: cover, executive summary, body, recommendations, and appendix.
This guide shows real slides, public decks you can study, action titles you can copy, and a slide-by-slide template.
What makes a slide a McKinsey slide
Your steering committee already knows the company. It wants a decision, not a research tour. Each rule below exists to get a busy reader to that decision faster.
| Rule | What it means | Quick test |
|---|---|---|
| Answer first | The recommendation is on the executive summary, before the proof | Can a reader stop after slide 2 and know what you want? |
| Action titles | The title is a full sentence that states the finding | Does the title contain a verb and a number or comparison? |
| One message per slide | One claim, one exhibit that proves it | Do you need the word "and" to describe the slide? Split it. |
| MECE grouping | Sections do not overlap and leave no gaps | Can any item sit in two sections? |
| Sources on every exhibit | A source line under each chart or table | Can a skeptical reader trace each number? |
| Appendix discipline | Detail that does not change the decision moves to the back | Would the decision change without this slide? |
The rest of this guide takes each rule in turn. If you only have five minutes, read Action titles and the executive summary section.
Download: McKinsey-style templates
McKinsey slide generator
Enter your recommendation → copy prompt or generate a full consulting deck in GenPPT
Consulting deck template
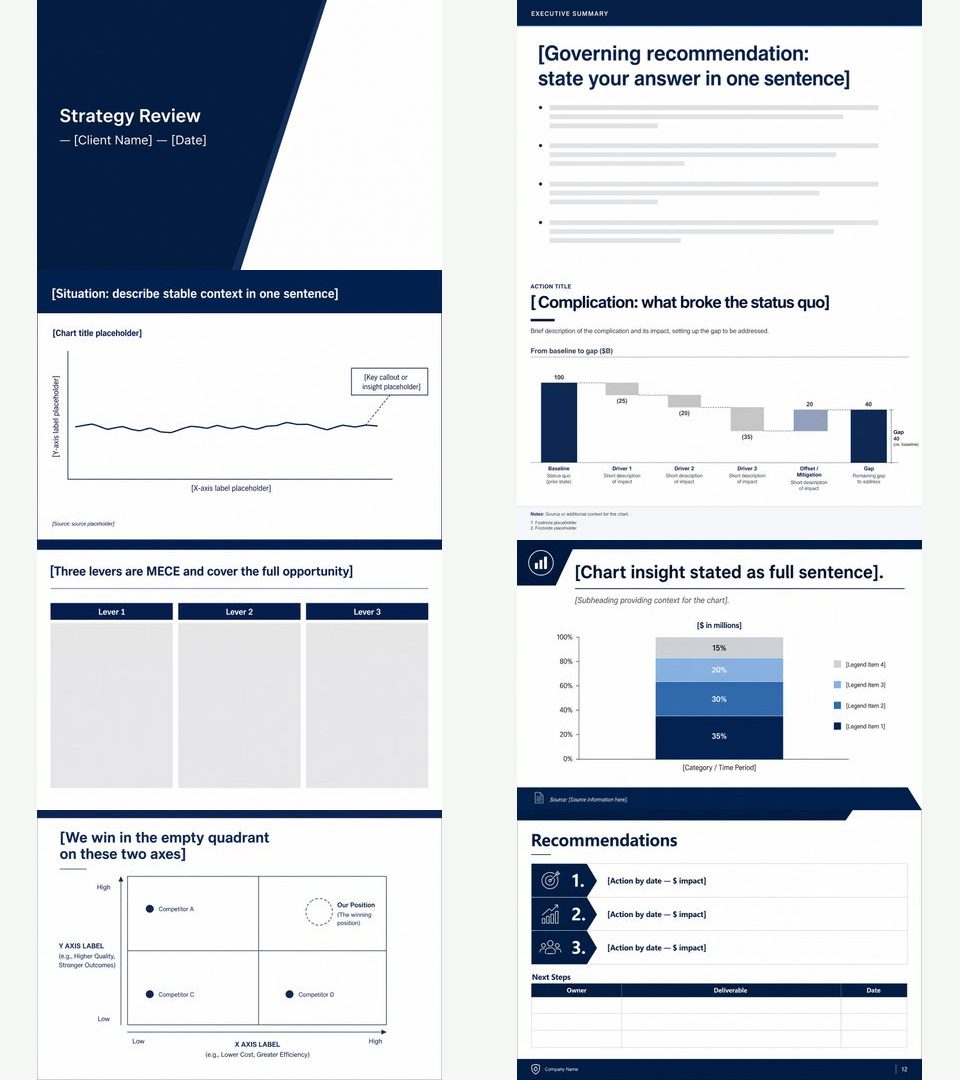
Preview all 8 slides, copy the default GenPPT prompt, download PDF
Consulting deck template PDF
Blank 8-slide structure with placeholders
McKinsey “Transforming for growth” webcast
Real published McKinsey deck. Study action titles and chart discipline
We found no official public download of McKinsey's internal PowerPoint template. The template here is a GenPPT-made 8-slide skeleton in the same style, as a PDF with fill-in placeholders.
Do you need a PowerPoint file? Generate the deck in GenPPT and export it as .pptx. For a template that you can edit box by box, set up your own in the Slide Master.
GenPPT prompt (copy and paste)
Use this at GenPPT or in the McKinsey slide generator. Fill in the three lines under "My engagement". Attach the template contact sheet as a style reference for navy and white consulting visuals.
Consulting-style strategy deck (McKinsey-style slides).

Structure requirements:
- Lead with the recommendation on the executive summary slide (Pyramid Principle: answer first)
- Use action titles: every slide headline is a complete sentence stating the insight, not a topic label
- MECE sections: mutually exclusive, collectively exhaustive groupings
- SCR storyline: Situation → Complication → Resolution
- One message per slide; one primary chart per slide
- Source footnote on every exhibit

Slide order (8-slide main path):
1. Cover: [Engagement title], [Client], [Date]
2. Executive summary: governing recommendation + 3 to 5 complete-claim bullets
3. Situation: stable context with baseline KPI chart
4. Complication: what broke the status quo (waterfall or bridge)
5. MECE overview: three levers that cover the full opportunity
6. Evidence: single chart proving key line 1
7. Competitive positioning: 2×2 matrix with defensible axes
8. Recommendations: numbered verb-led actions + next steps table (owner, deliverable, date)

My engagement:
- Audience: [Board / steering committee / client leadership]
- Governing recommendation: [State your answer in one sentence]
- Context: [Industry, company, decision at stake]

Visual style: navy and white executive palette, minimal decoration, large headline type, generous whitespace, professional consulting layout. Match the attached reference contact sheet for typography and density.Real McKinsey slide examples (2024 webcast)
The examples below come from the slides of McKinsey's "Transforming for growth" webcast, dated November 14, 2024 and presented by three McKinsey partners. It is webcast material for an outside audience, not a client deck.
Use it to study how the firm writes action titles and builds charts today. The deck has 18 slides. It carries McKinsey's standard proprietary notice, so use it to learn the method, not to reuse the slides.
Cover slide: minimal, client-facing
McKinsey cover slides stay sparse: title, presenters or client, date. No agenda on the cover. No chart thumbnails.
Action title + stacked bar: one chart, one message
This slide passes the 1-3-1 check we use later in this guide: one key message, up to three supporting points in the exhibit, one clear visual.
The action title states the finding: "Growth begins in the core and top growers expand beyond the core to drive growth." The subheading defines the data: "Share of total revenue growth, N=1,874."
The stacked bars prove the title. The core business gives 69% to 90% of revenue growth in each of the eight industries shown.
Compare a weak version of the same slide:
| Weak topic title | McKinsey action title (actual) |
|---|---|
| Revenue growth by industry | Growth begins in the core and top growers expand beyond the core to drive growth |
The weak title forces the reader to interpret the chart. The action title tells them what to see before they look at the bars.
MECE framework slide: mutually exclusive buckets
Consultants use framework slides to show the MECE structure before the proof. This slide groups growth levers into three pathways (core, adjacencies, breakout) under one aspiration.
Each bucket is distinct. Together they cover the growth agenda.
Numbered list slide: scannable executive read
When the exhibit is qualitative (mindsets, practices, recommendations), McKinsey uses numbered or lettered blocks with short verb-led phrases. The action title still carries the governing thought; the list proves it.
Sensitivity matrix: data proves a specific claim
Consulting charts match the comparison you need. They are not decoration.
This matrix shows the implied value per share for each combination of revenue growth and profit margin. The title explains why the exhibit exists: an external lens sets the growth ambition.
Venn + puzzle frameworks: visual MECE
When the argument is structural ("prioritize based on X, support through Y"), consultants use simple diagrams with restrained color. Two frameworks on one slide works only when both support the same action title.
Download the full 18-slide webcast PDF
More public McKinsey decks to study
One webcast is not enough to learn the style. These four decks are McKinsey work that the client or host published on its own website. We opened each file on October 2, 2026 to confirm the link, the date, and the page count.
| Deck | Date and length | What to study |
|---|---|---|
| USPS Future Business Model | March 2010, 39 pages | A full storyline: recent context, base case, actions within USPS control, then fundamental change. A small section label sits above each title. |
| Transportation and Warehousing Sector Analysis (Federal City Council, Washington DC) | October 2020, 40 pages | Titles carry a number (1b, 2a, 2b) that ties each proof slide to one of five challenges. |
| Financial Impact Assessment on 2020 Revenue of COVID-19 (Metropolitan Transportation Authority, New York) | May 2020, 38 pages | Scenario analysis: two ridership scenarios run through fare, toll, and tax revenue, then one summary table. The file opens with disclaimer pages. |
| Context for Global Growth and Development (McKinsey Global Institute, for a UN session) | November 2014, 11 pages | Short titles that each state one claim, several with a number in them. A good first deck to read. |
How to study a deck in 10 minutes:
- Read only the titles, from first slide to last. Write down the argument in three sentences.
- Pick one chart slide. Cover the title and write your own. Compare it with the original.
- Find the executive summary or the closest slide to it. Check which body slides prove each line.
- Note what is missing: animation and clip art. Topic-label titles do appear (the USPS deck has "Pricing opportunities for USPS"), but they are the exception.
The USPS deck opens its context section with a five-word title: "USPS is experiencing unprecedented losses" (McKinsey, 2010). That is the standard to copy: a claim, not a label.
For larger collections, Slideworks and Slide Science both keep lists of 150 or more public McKinsey decks. Many of those links go to third-party hosts, so check the source before you rely on a file.
The five-part McKinsey deck structure
Most consulting deliverables follow the same spine. Slide counts change with the size of the project. The sections stay the same.
| Section | Slides (typical) | Job |
|---|---|---|
| 1. Cover | 1 | Engagement title, client, date. Minimal. |
| 2. Executive summary | 1 to 2 | Governing message plus 3 to 5 supporting claims. The deck in miniature. |
| 3. Body | 10 to 50 or more | Evidence in MECE sections. Each section opens with its conclusion. |
| 4. Recommendations and next steps | 2 to 4 | Numbered, verb-led actions with owners and dates. |
| 5. Appendix | Often longer than the main deck | Backup charts, methodology, detailed tables. Referenced, not presented. |
Slideworks, a firm of former McKinsey, BCG and Bain consultants, reports that the body of a client deliverable often has 50 or more slides and that the appendix can be much longer than the main deck. Those are their observations, not official McKinsey numbers.
Public decks are shorter. The median in the Slideworks collection is 38 pages, and the 2024 growth webcast is 18 slides.
Section 1: Cover slide
Keep three elements: project name (under about 8 words), client or audience, date. A confidentiality label is optional.
Some McKinsey decks use the client's template and logo. Others use the firm's template. It depends on how the client wants to share the work.
Section 2: Executive summary
The executive summary slide is usually the slide that takes the longest to write. It carries the governing thought: one sentence that states what the audience should believe or do.
Copy this structure. It follows Situation, Complication, Resolution:
Title: [Client] should [action] to [result] by [date]

Situation: [One sentence of context that everyone in the room accepts.]
Complication: [One sentence on what changed and what it costs.]
Resolution:
1. [Key line 1 as a full sentence with a number]
2. [Key line 2 as a full sentence with a number]
3. [Key line 3 as a full sentence with a number]
Next step: [The decision you need, the owner, the date]
Below the governing thought, add 3 to 5 bullets. Each bullet is a complete claim:
| Weak bullet (process) | Strong bullet (finding) |
|---|---|
| We analyzed freight spend across regions | Freight costs exceed benchmark by 12% due to lane consolidation gaps |
| Our research found churn issues | Churn concentrates in accounts under $50K ARR: 2.4× the enterprise rate |
| We recommend pricing changes | Tiered pricing in low-churn segments can recover 80 bps margin by Q4 |
Executive summary bullets should mirror the action titles of the body sections, in order. The summary becomes a table of contents written as conclusions.
Section 3: Body
The body holds the quantitative and qualitative proof. Break it into 3 to 5 MECE sections. Each section starts with a section divider whose title is the conclusion of that section.
Within a section, keep one message per slide. For competitive positioning, the 2×2 matrix from our competition slide guide fits this style when you can defend both axes.
Section 4: Recommendations and next steps
Recommendations are specific and verb-led:
| Weak | Strong |
|---|---|
| Improve procurement efficiency | Renegotiate top-five supplier contracts by Q3 to capture $4.2M |
| Invest in digital | Launch self-serve onboarding by Feb 2027 to cut CAC 18% |
| Fix pricing | Roll out tiered pricing in Q4 for accounts with NPS above 8 |
Group recommendations when you have more than five. Label the groups (Quick wins, Structural, Enablers). Write in the active voice and start with a verb: Grow, Reduce, Target, Accelerate.
The next steps slide assigns an owner, a deliverable, and a date to each action. Skip vague "further analysis" rows.
| Action | Owner | Deliverable | Date |
|---|---|---|---|
| Approve the pilot budget | CFO | Signed budget | Mar 15 |
| Renegotiate the top-five supplier contracts | CPO | New terms in place | Jun 30 |
| Launch tiered pricing in two regions | Head of Sales | Live price list | Sep 1 |
Section 5: Appendix
The appendix holds the backup for questions: cohort cuts, survey results, model tabs, interview quotes. Presenters skip it in the meeting unless someone asks.
Refer to appendix slides from footnotes on body slides ("See A-14 for full cohort cut").
Slide anatomy, 1-3-1, and the read-through test
Every consulting slide has three required parts plus a footer:
┌─────────────────────────────────────────────────────────┐
│  ACTION TITLE (complete sentence = the insight)         │
│  Subheading: what data proves the title                 │
├─────────────────────────────────────────────────────────┤
│                                                         │
│  EXHIBIT (chart, table, framework: one message)        │
│                                                         │
├─────────────────────────────────────────────────────────┤
│  Source: [footnote]                    McKinsey & Co  5│
└─────────────────────────────────────────────────────────┘
Rules:
- Nothing in the action title that the exhibit does not support
- Nothing in the exhibit that the action title does not need
- Subheadings add scope: "US market, $ billions, 2020 to 2025" or "Forecasted battery cost by 2030 ($/kWh)"
The 1-3-1 check. This is our shorthand for a slide that carries one message. It is not an official McKinsey rule.
| Check | Rule |
|---|---|
| 1 key message | One governing thought per slide |
| 3 supporting points max | In bullets, chart segments, or callouts |
| 1 clear visual | One primary exhibit; split if you need two messages |
The read-through test. Read the slide titles only, in order. In PowerPoint, open Outline View, right-click the outline, and select Collapse, then Collapse All, to list the titles alone.
You should know the recommendation by the end, and each title should follow from the last. If someone has to read the chart aloud to explain the point, rewrite the title or split the slide.
The "so what" test. Read the title and ask "so what?". If the answer is a better sentence than the title, that answer is your title.
Pyramid Principle: answer first, then prove
Barbara Minto joined McKinsey in 1963 and worked there until 1973. Her Pyramid Principle stacks ideas in three levels:
              [Governing recommendation]
                     /    |    \
          [Key line 1] [Key line 2] [Key line 3]
             /  \         |           /  \
       [Evidence] [Evidence] ...   [Evidence]
Top level: the answer you want approved.
Middle level: 3 to 5 supporting arguments (MECE).
Base level: data, charts, quotes, and analysis that prove each argument.
The working rule: build the pyramid from the bottom up, then present it from the top down. Most analysts want to walk through the journey. Executives want the destination first, then the map.
In deck terms, the top of the pyramid is the executive summary title. The middle level becomes your section dividers. The base becomes the body slides.
Worked example: margin recovery deck
Governing thought (executive summary title): "Acme should prioritize pricing and mix to recover 200 bps margin by FY27."
Key lines (MECE):
- Discount depth, not volume, is the primary margin driver
- Three levers can recover margin without exiting mid-market
- Implementing all three levers yields 200 bps by FY27
Evidence slides (sample action titles under key line 1):
- Revenue grew 8% but margin compressed as discounting outpaced volume
- Competitors undercut list price 15% to 22% in mid-market segments
- Discount depth correlates with churn: low-churn accounts tolerate 4% to 6% list increases
Each evidence slide is one block in the base of the pyramid. Read those three titles in order. The logic should hold without the charts.
The company and the numbers in this example are invented to show the pattern.
SCR and SCQA: the consulting storyline
The Pyramid Principle structures the argument. SCR and SCQA structure the story that leads into it. Use them for the executive summary and the first slides of the deck.
SCR (Situation → Complication → Resolution)
| Beat | What it does | Example |
|---|---|---|
| Situation | Stable context everyone accepts | Regional revenue grew 8% last year on existing product lines |
| Complication | Change that breaks the status quo | Two new entrants undercut pricing 20% in our core segment |
| Resolution | Recommendation that resolves the complication | Unbundle enterprise tier and reinvest savings in channel incentives |
SCQA (adds an explicit Question)
Insert a Question after the complication: "How do we protect share without destroying margin?" The Answer is your governing recommendation.
Use SCQA when the audience might disagree on how to frame the problem. The explicit question gets agreement on the problem before you give the answer.
Copy this SCQA opener and fill it in:
Situation: [Client] has [stable fact] for [period].
Complication: [Change] now threatens [metric] by [amount].
Question: How can [client] [goal] without [trade-off]?
Answer: [Client] should [action 1], [action 2], and [action 3] to [result] by [date].| Use | When |
|---|---|
| SCR | The audience already agrees on the problem. You go straight to the resolution. |
| SCQA | The problem is disputed or new. You state the question so that everyone answers the same one. |
Action titles
An action title is a slide headline written as a complete sentence that states the takeaway of the slide.
From the 2024 webcast (actual titles):
- "Leaders use a holistic growth blueprint to achieve sustained profitable growth"
- "Growth begins in the core and top growers expand beyond the core to drive growth"
- "5 practices consistently underpin growth transformation outperformers"
Action titles state a claim. Topic titles state a category. Claims give executives something to approve or push back on.
How to write action titles
- Finish the exhibit first (or sketch it). What is the one number or pattern that matters?
- Write the "so what" as a complete sentence with a subject and verb
- Replace vague words ("significant," "various") with numbers or comparisons
- Cut it to two lines. Slideworks, a firm of former consultants, sets the limit at two lines and about 15 words
- Read adjacent titles in sequence. If the flow breaks, rewrite before you touch chart colors
If you cannot write a clear action title, the slide probably mixes two ideas. Split it.
Action title formulas
Most action titles follow one of six patterns. Copy the one that fits your exhibit:
[Metric] [rose / fell] [amount] since [date] because [driver]
[Segment A] outperforms [Segment B] by [amount] on [metric]
[Number] of [total] [items] account for [share] of [outcome]
[Option A] beats [Option B] on [criterion] at [lower cost / lower risk]
[Client] should [action] by [date] to [result]
[Risk or gap] will cost [amount] by [date] unless [action]
Action title examples you can copy
The left column is the topic label most decks use. The right column is the action title that replaces it.
The numbers are placeholders. Put in your own.
Growth and market
| Topic label | Action title |
|---|---|
| Market overview | The market grows 9% a year, and the mid-market segment grows twice as fast |
| Customer segments | Two segments produce 70% of profit but get 30% of sales time |
| Competitor analysis | Competitors win on price at the low end but lose on service in enterprise |
| Market entry options | A partnership reaches break-even two years sooner than a solo launch |
| Customer research | Buyers rank delivery speed above price in four of five segments |
Cost and operations
| Topic label | Action title |
|---|---|
| Cost breakdown | Logistics causes 40% of the cost gap against the benchmark |
| Procurement review | Five suppliers hold 72% of spend, and three contracts expire this year |
| Process analysis | Rework adds six days to each order and affects one order in four |
| Headcount trend | Overhead headcount grew 18% while revenue grew 5% |
| Benchmark | Peers of the same size operate with 20% fewer management layers |
Pricing and margin
| Topic label | Action title |
|---|---|
| Pricing analysis | Discounts above 15% do not raise win rates |
| Margin trend | Margin fell 3 points because the mix moved to the low-margin line |
| Churn data | Accounts without onboarding churn at three times the rate of onboarded accounts |
| Scenario analysis | The plan holds in two of three scenarios, and a price war breaks it |
Organization and technology
| Topic label | Action title |
|---|---|
| Org structure | Three teams own the same decision, which adds four weeks to each launch |
| Survey results | Managers rate strategy clarity 30 points lower than executives do |
| Technology assessment | The current platform cannot support more than two new markets |
Recommendations, risks, and status
| Topic label | Action title |
|---|---|
| Recommendations | Close two of five warehouses by Q3 to save $4M a year |
| Next steps | The board should approve the pilot budget by March 15 |
| Risks | Supplier concentration is the one risk that can delay the plan |
| Timeline | The rollout reaches all regions in three phases over 12 months |
| Project status | The program is two weeks behind because vendor selection slipped |
| KPI dashboard | Four of six KPIs meet target, but on-time delivery and NPS do not |
| Financial overview | Revenue beat plan by 4%, but cash conversion fell to 61% |
Do you have the titles but not the slides? Give GenPPT your recommendation and ask for action titles. It drafts an outline for you to approve before it designs anything.
MECE: organize the body without gaps or overlap
MECE (Mutually Exclusive, Collectively Exhaustive) is the consulting rule for grouping ideas. It is part of Minto's Pyramid Principle.
- Mutually exclusive: each bucket belongs in one place only
- Collectively exhaustive: together, the buckets cover everything relevant
Example: cost reduction deck:
| MECE section | Includes | Excludes |
|---|---|---|
| Procurement | Supplier rates, contract terms | Headcount |
| Operations | Yield, scrap, line efficiency | Marketing spend |
| Overhead | Real estate, shared services | Product COGS |
MECE applies to section structure, bullet groups, and chart breakdowns. Overlapping pie segments invite a challenge in the Q&A.
Five splits that are MECE by construction:
| Split | Example |
|---|---|
| Math | Profit = revenue minus cost. Revenue = price times volume. |
| Process | Source, make, deliver, service |
| Segments | Enterprise, mid-market, small business |
| Time | Next 90 days, this year, years 2 to 3 |
| Opposites | Internal and external. Organic and acquired. |
Two quick tests:
- Can one item sit in two buckets? Then the buckets overlap.
- Can you name something relevant that fits in no bucket? Then there is a gap.
McKinsey vs BCG vs Bain: same logic, different emphasis
All three firms share the same base: conclusions first, action titles, and a disciplined appendix. The visible differences are in branding:
| Dimension | McKinsey | BCG | Bain |
|---|---|---|---|
| Brand color | Blue (dark blue plus a bright blue) | Green | Red |
| Slide fonts | Georgia for titles, Arial for body (per Slideworks) | Trebuchet MS (reported) | Not verified |
| Known for | Pyramid Principle, MECE | Growth-share matrix (the BCG matrix) | Net Promoter Score |
The McKinsey colors and fonts come from the Slideworks analysis of the identity that the firm introduced in February 2019. The BCG font is reported by former consultants, and we did not verify it against a firm document.
Treat every style comparison between the firms with care. Decks differ more by team and client than by firm. You do not need a firm-branded template to apply the logic: pick one palette and one font pair, and enforce action titles.
Ghost deck: structure before design
Consultants build a ghost deck first: every slide title in final order, placeholder boxes for exhibits, no polished design.
Workflow:
- Write the governing thought for the executive summary
- List 3 to 5 key lines that support it (MECE)
- Under each key line, draft action titles for the proof slides
- Add the recommendation and next steps titles
- Run the read-through test
- Only then design charts and pick layouts
A common habit is to sketch the sections on paper, build empty slides with titles only, print them, and lay them on a table to check the flow. PowerPoint Slide Sorter view does the same job.
The ghost deck also tells you which analysis to do. An empty exhibit box with a clear title is a work order: find the data that proves or disproves this sentence.
GenPPT works in the same order. It drafts the outline first, you approve it, and only then does it generate the slides.
The 10 slide types that cover most consulting decks
You do not need 50 layouts. These ten cover most of what a consulting deck has to say.
| Slide type | Use it when | Title pattern |
|---|---|---|
| Executive summary | The reader needs the full answer on one page | [Client] should [action] to [result] |
| Single-chart slide | One number or trend proves the point | [Metric] [changed] [amount] because [driver] |
| Framework or pillars | You group levers or options into MECE buckets | Three levers close the gap |
| Issue tree | You split a question into parts to analyze | The gap comes from price, volume, and mix |
| Waterfall (bridge) | You explain how one number becomes another | Discounts explain most of the margin decline |
| 2×2 matrix | You position options on two axes | Two initiatives are high impact and low effort |
| Comparison table | You rate options against criteria | Option B meets four of five criteria |
| Roadmap | You show the sequence of actions | The plan delivers in three phases over 12 months |
| Section divider | A new section starts | The conclusion of the section, as a sentence |
| Next steps | You need decisions, owners, and dates | The board should approve [decision] by [date] |
For the comparison table, Harvey balls show ratings at a glance without a column of numbers.
Charts and design rules
Pick the chart for the comparison you need:
| When you need to show… | Chart type | Action title pattern |
|---|---|---|
| Change over time | Line chart | "X grew N% while Y flatlined since 2022" |
| Contribution to a total | Waterfall / bridge | "Margin erosion is driven primarily by discount depth" |
| Part-to-whole at one point | Stacked bar (100%) | "Growth begins in the core across every sector" |
| Two-axis positioning | 2×2 matrix | "We win in the empty quadrant on price vs service" |
| Scenario sensitivity | Table / matrix | "Share price requires 6.5%+ CAGR at 13%+ margin" |
| Before vs after | Side-by-side bars | "Pilot cut fulfillment time 40% in six weeks" |
| Rank order | Horizontal bar | "Top three suppliers account for 72% of spend" |
Design rules:
| Rule | What consultants do |
|---|---|
| One message per slide | Split dual-chart slides |
| Action title + exhibit + footnote | Title = insight; body = proof; footer = source |
| Restrained palette | Navy, white, one accent |
| Consistent typography | 2 to 3 sizes at most; titles of two lines or less |
| No animation | Static slides for boardrooms and PDFs |
| Appendix discipline | Move detail that invites debate to the backup |
- One message per chart. Two messages need two charts
- Direct labels on bars and lines, so that the reader does not hunt through a legend
- A callout box for the one number the reader must remember
- A source line on every exhibit. Label estimates as estimates
For waterfall and Mekko charts that stay linked to Excel inside PowerPoint, see think-cell alternatives.
Set up a McKinsey-style PowerPoint template
McKinsey's brand fonts are Bower (serif) and McKinsey Sans. In PowerPoint files the firm replaces them with Georgia for titles and Arial for body text, because custom fonts make files hard to share with clients. This is the Slideworks analysis of the identity from February 2019.
You can build a template in that style in the Slide Master. The settings below are our recommendations from public decks. They are not an official McKinsey specification.
| Element | Setting |
|---|---|
| Slide size | Widescreen 16:9 |
| Title | Georgia, top left, room for two lines, no bold |
| Body and chart labels | Arial, one size for body, one smaller size for labels and sources |
| Colors | White background, dark blue text and shapes, one bright blue accent, two grays |
| Subheading | One line under the title that names the data, unit, and period |
| Footer | Source line bottom left, page number bottom right |
| Section tracker | Small section label above the title, optional |
Steps in PowerPoint:
- Open View, then Slide Master.
- Select Fonts, then Customize Fonts. Set the heading font to Georgia and the body font to Arial.
- Select Colors, then Customize Colors. Enter your dark blue, bright blue, and grays.
- On the top master slide, move the title placeholder to the top left. On each exhibit layout, select Insert Placeholder, then Text, and draw a source line at the bottom left.
- Keep six layouts and delete the rest: cover, executive summary, title plus one exhibit, title plus two columns, section divider, and end slide.
- Close the master view and save the file as a PowerPoint Template (
.potx).
To change a template that you already have, see how to edit a PowerPoint template.
Copy-ready template: 8-slide main path
Use this interactive outline, then download the PDF template or open it in GenPPT.
McKinsey-style consulting deck (8 slides)
Cover: [Engagement title], [Client], [Date]
Project name under 8 words
Client name or logo
Date and confidentiality label if needed
Try this in GenPPT
Create this presentation in seconds
Move methodology, survey tabs, and model backups to the appendix. Refer to them from footnotes on body slides.
Eight slides fit a short decision meeting. For a longer readout, use the 15-slide template below.
Template slide previews
Our downloadable 8-slide PDF uses the 8-slide structure above. Preview:
Slide-by-slide template: 15-slide consulting deck
Use this when the decision needs more proof than eight slides can hold. Each row gives the job of the slide and a title formula to fill in.
| # | Slide | Title formula |
|---|---|---|
| 1 | Cover | [Project name], [client], [date] |
| 2 | Executive summary | [Client] should [action] to [result] by [date] |
| 3 | Situation | [Metric] has held at [level] since [year] |
| 4 | Complication | [Change] now puts [metric] at risk of [consequence] |
| 5 | Answer overview | Three levers close the gap: [A], [B], and [C] |
| 6 | Lever A, proof 1 | [Driver] explains [share] of the gap |
| 7 | Lever A, proof 2 | [Segment] has the largest upside at [amount] |
| 8 | Lever B, proof 1 | [Lever B] can deliver [impact] without [trade-off] |
| 9 | Lever B, proof 2 | [Peer or benchmark] already operates at [level] |
| 10 | Lever C, proof | [Lever C] adds [impact] at [cost or risk] |
| 11 | Options | Option [X] gives the highest return for the lowest risk |
| 12 | Total impact | Together the three levers deliver [total] by [date] |
| 13 | Risks | Three risks matter most, and each has a mitigation |
| 14 | Roadmap | The plan delivers in three phases over [N] months |
| 15 | Next steps | [Owner] should approve [decision] by [date] to start phase 1 |
Slides 3 and 4 are the Situation and Complication. Slide 5 is the middle level of the pyramid. Slides 6 to 10 are the base.
Three rules for when you adapt it:
- Keep the balance. The first four slides set up the answer and the last three turn it into action. Everything between is proof.
- Add proof slides, not sections. If a lever needs a third chart, add it under that lever.
- Send the rest to the appendix. Methodology, data tables, and the options you rejected go behind slide 15.
Consulting-style deck topics to start from
No project at hand? Practice the structure on one of these. Each row starts a deck with that topic in GenPPT.
- Market entry strategy for a retail bank expanding into Southeast AsiaCreate
- Cost reduction plan for a mid-size logistics companyCreate
- Margin recovery plan for a B2B software companyCreate
- Growth strategy with three pathways for a consumer brandCreate
- Post-merger integration plan for two regional hospital groupsCreate
- Pricing strategy review for a subscription businessCreate
- Digital transformation roadmap for a regional insurerCreate
- Go-to-market strategy for a new product lineCreate
Common mistakes (and fixes)
| Mistake | Why it fails | Fix |
|---|---|---|
| Topic titles ("Financial overview") | Reader must interpret the chart | Rewrite as action titles |
| Recommendation last | Executives stop listening | Lead exec summary with the answer |
| Two messages on one slide | Breaks read-through test | Split into two slides |
| Bullets start with "We analyzed…" | Process, not finding | State the finding only |
| Chart junk / 3D effects | Hides the data | Flat charts, direct labels |
| No sources on estimates | CFO will challenge in Q&A | Footnote every exhibit |
| Walking through the appendix | Burns time on non-decisions | Stay on main path; offer backup on demand |
| Paste-up from multiple decks | Inconsistent logic | Rebuild ghost deck from governing thought |
Send the executive summary to the key stakeholders before the steering meeting. Consultants call this pre-wiring. The meeting then confirms a decision instead of producing surprises.
Checklist before you send the deck
Run these eight checks in order. Each takes a minute or two.
- Titles only. Read every title in sequence. Do they give the full argument?
- Slide 2. Does the executive summary state the recommendation and the decision you need?
- One message. Does any slide need "and" to describe its point? Split it.
- Title matches exhibit. Does every chart prove exactly what its title says?
- Numbers. Does every number in a title appear in the exhibit below it?
- Sources. Does every exhibit have a source line, with estimates labeled?
- Two lines. Is every title two lines or less?
- Appendix. Have you moved every slide that does not change the decision?
When McKinsey-style slides are the wrong fit
Use a different structure when:
- You are fundraising. Investor pitches go from problem to market to traction to the ask. See our pitch deck hub and the 10-20-30 rule.
- You report weekly status. A steering committee wants red, amber, green at a glance. Use the project status report template.
- You are teaching. Training decks need step-by-step slides. Break the "answer first" rule on purpose.
- You have five minutes. A three-slide brief beats a 40-slide consulting pack. Match the slide count to your slot with how many slides per minute.
- You tell a story to a large room. Keynotes use few words and large images. Dense exhibits do not work from the back row.
Build with GenPPT
GenPPT makes the first full draft of a consulting-style deck. You give it a prompt, a PDF, a Word document, a text file, images, or a link.
It researches the topic and drafts an outline. You approve the outline, pick a visual concept, and get designed slides about 2 to 3 minutes later.
- Open the McKinsey slide generator and enter your governing recommendation, or paste the prompt from the top of this page into GenPPT
- Read the outline before you approve it. If a title is only a topic label, ask in chat for an action title
- Upload the template contact sheet as a style reference if you want the navy and white look
- Edit single slides in chat until the titles and exhibits agree
- Export
.pptxor PDF, then read the titles alone once more before the meeting
Know the limits. GenPPT slides are full-slide designs, so charts are not linked to Excel. Check every number and claim yourself.
For exhibits that must stay linked to a model, rebuild those charts in PowerPoint or think-cell after export.
The price: a $1 trial gives you 3 days of full access (card required). After that it is $25 a month or $99 a year for 20 decks a month, with PowerPoint and PDF export without a watermark. There is no free plan.
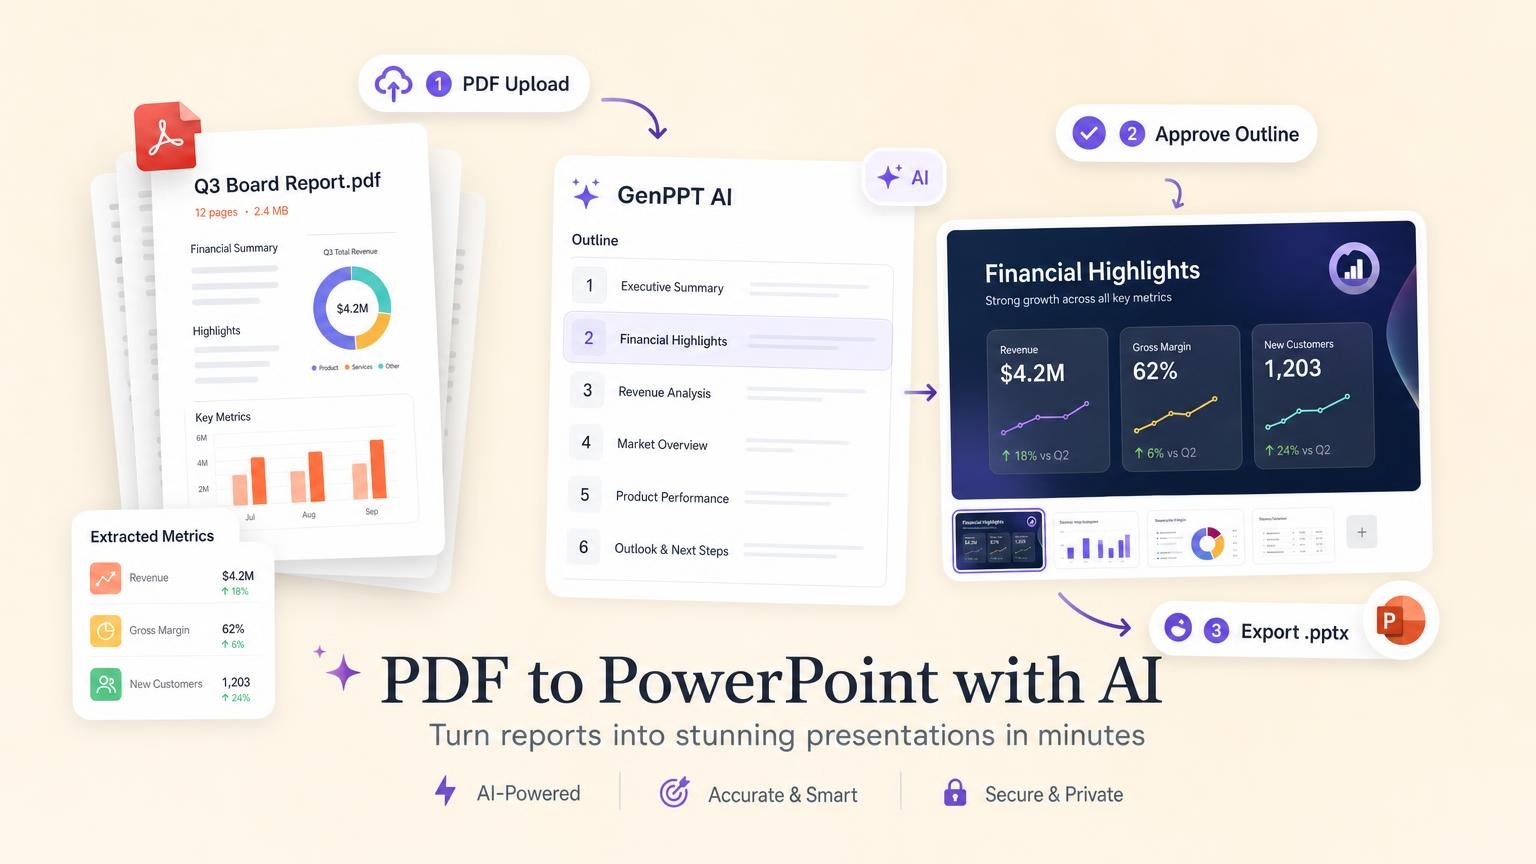
You can also open the consulting deck template to preview the slides and download the PDF. If your source is a long report, see PDF to PowerPoint with AI.
FAQ
What is a McKinsey-style slide?
It is a slide with a full-sentence action title, one exhibit that proves the title, and a source line. The title states a conclusion, not a topic. The deck around it puts the recommendation first and groups the proof into MECE sections.
What is an action title?
An action title is a slide title written as a complete sentence that states the conclusion of the slide. "Logistics causes 40% of the cost gap" is an action title. "Cost analysis" is a topic label. Keep action titles to two lines.
How many slides are in a McKinsey presentation?
It depends on the type of deck. Slideworks, a firm of former consultants, reports that the body of a client deliverable often has 50 or more slides, with an appendix that can be longer. Public decks are shorter: the median in the Slideworks collection is 38 pages, and the 2024 growth webcast linked above is 18 slides.
What font does McKinsey use?
McKinsey's brand fonts are Bower and McKinsey Sans. In PowerPoint the firm uses Georgia for titles and Arial for body text, according to the Slideworks analysis of the identity from February 2019. A consistent hierarchy matters more than a match with the firm's fonts.
Does McKinsey have an official PowerPoint template?
McKinsey uses its own template internally, and we found no official public download. Files sold or shared online as a "McKinsey PPT template" are third-party templates in the same style. You can set up your own or start from our 8-slide template PDF.
Can I download real McKinsey slides?
Yes, when the client or McKinsey has published them. This guide links four public decks on the USPS, Federal City Council, MTA, and UN websites, plus the 2024 webcast PDF. Internal client decks stay confidential, and public decks stay under McKinsey's copyright, so study them but do not copy slides.
Can AI build McKinsey-style slides?
Yes, for structure and a first designed draft. GenPPT drafts an outline from a prompt or a PDF, and you approve it before the slides are generated. Ask for action titles in the prompt, verify the numbers yourself, and rebuild Excel-linked charts in PowerPoint for board-ready exhibits.