
A project status report template has seven parts: overall status (red, amber, or green), a short summary, work completed, work planned, risks and blockers, budget, and the decisions you need. Copy the text template below, fill in the brackets, and send it as an email, a one-page document, or an 8-slide deck.
This page gives you the full template, a weekly and a monthly version, a filled example, RAG definitions, and a slide-by-slide outline for PowerPoint or Google Slides.
Copy-and-paste project status report template
This is the full version. It fits one page. Delete the sections you do not need, such as budget on a small internal project.
PROJECT STATUS REPORT

Project: [Project name]
Reporting period: [Start date] to [end date]
Prepared by: [Name, role]
Sponsor: [Name]
Overall status: [GREEN / AMBER / RED]

1. SUMMARY
[2 to 3 sentences: what changed, the top risk,
and the one thing you need from the reader.]

2. STATUS BY AREA
Schedule: [G / A / R] - [one-line reason]
Scope:    [G / A / R] - [one-line reason]
Budget:   [G / A / R] - [one-line reason]
Risk:     [G / A / R] - [one-line reason]

3. COMPLETED THIS PERIOD
- [Milestone or deliverable] ([date])
- [Milestone or deliverable] ([date])
- [Milestone or deliverable] ([date])

4. PLANNED NEXT PERIOD
- [Milestone or deliverable] - [owner] - [target date]
- [Milestone or deliverable] - [owner] - [target date]
- [Milestone or deliverable] - [owner] - [target date]

5. RISKS AND BLOCKERS
- [Risk or issue]. Impact: [what it delays or costs].
  Owner: [name]. Mitigation: [action and date].

6. BUDGET
Approved budget: [amount]
Spent to date: [amount]
Forecast at completion: [amount]
Variance: [amount and reason]

7. DECISIONS AND ASKS
- [Decision needed] - [from whom] - [by date]

Links: [project plan] [task tracker] [risk log]
Keep the order the same in every report. Readers learn where to look, and you only change the content.
Do you present this in a meeting? Start the deck from the same structure.
What belongs in a project status report deck
A project status report is a short, regular update that tells sponsors and stakeholders where the project stands against its plan.
Your status report, on slides or on paper, answers four questions for sponsors and cross-functional partners:
- Are we on track? (schedule, scope, budget)
- What got done since the last report?
- What could derail us?
- What do you need from the reader this week?
Each section of the template maps to one of those questions.
| Section | What to write | Length |
|---|---|---|
| Header | Project, reporting period, author, overall RAG | 4 to 5 lines |
| Summary | What changed, top risk, one ask | 2 to 3 sentences |
| Status by area | Schedule, scope, budget, risk: a color and a reason | 1 line each |
| Completed | Outcomes and milestones, not activity | 3 to 5 bullets |
| Planned next | Milestone, owner, target date | 3 to 5 bullets |
| Risks and blockers | Issue, impact, owner, mitigation | Top 3 to 5 |
| Budget | Approved, spent, forecast, variance | 4 lines |
| Decisions and asks | The choice, who makes it, the deadline | 1 to 3 bullets |
An email and a document cover the same ground as a deck. On slides you pick the hierarchy: headlines up front, detail in the notes or the appendix.
| Audience | Typical cadence | Slide budget |
|---|---|---|
| Executive steering | Monthly | 8 to 10 slides |
| Client delivery | Biweekly | 10 to 12 slides |
| Internal team update | Weekly | 5 to 6 slides |
The 8 to 10 slide budget fits a 15 to 20 minute readout. For other time slots, see how many slides per minute.
Status report vs. progress report
A status report is a snapshot: where the project stands today against the plan, and whether it is healthy. A progress report describes the work done over a period.
Most teams combine the two. The template above does that: sections 1 and 2 are status, sections 3 and 4 are progress.
RAG status: what red, amber, and green mean
RAG stands for red, amber, green. Many US teams say red, yellow, green. It is a traffic-light rating that tells the reader in one word how much attention the project needs.
| Status | Meaning | Example threshold | What you ask for |
|---|---|---|---|
| Green | On track. Inside the agreed tolerances. | Milestones slip less than 1 week. Cost less than 5% over. | Nothing. |
| Amber | At risk. The team can recover with its own plan. | A milestone slips 1 to 2 weeks. Cost 5 to 10% over. | Awareness. Show the recovery plan. |
| Red | Off track. The team cannot recover without help. | A milestone slips more than 2 weeks, or go-live will be missed. Cost more than 10% over. | A decision, money, or people. |
The thresholds are examples, not a standard. Agree on your own numbers with the sponsor at kickoff and use them in every report.
Three rules keep the colors honest:
- The overall status is no better than your worst area. One red area with three green areas is not a green project.
- Every amber or red has a reason, an owner, and a date. A color with no explanation only creates questions.
- Change a color the week the facts change. A project that is green for months and then turns red in one step costs you the sponsor's trust.
Weekly status report template
The weekly report is short. It fits one screen of an email, and it looks only at the last 7 days and the next 7 days.
Subject: [Project] weekly status: [GREEN / AMBER / RED],
week ending [date]

Overall status: [GREEN / AMBER / RED]
Summary: [2 to 3 sentences: what changed, the top
risk, and your ask.]

Status by area
Schedule: [G / A / R] - [one-line reason]
Scope:    [G / A / R] - [one-line reason]
Budget:   [G / A / R] - [one-line reason]
Risk:     [G / A / R] - [one-line reason]

Done this week
- [Outcome, not activity]
- [Outcome, not activity]
- [Outcome, not activity]

Planned next week
- [Deliverable] - [owner] - [date]
- [Deliverable] - [owner] - [date]

Blockers and risks
- [Issue]. Impact: [effect on date, scope, or cost].
  Owner: [name]. Need: [what, from whom, by when].

Decisions needed
- [Decision] - [from whom] - [by date]

Key dates
- [Next milestone]: [date] ([on track / at risk / late])
- [Go-live or delivery]: [date] ([on track / at risk / late])
Put the color in the subject line. A busy sponsor then knows which reports to open first.
Monthly status report template
The monthly report goes to people who do not follow the project each day: the steering committee, executives, or the client. They want the trend, the money, and the forecast.
| Item | Weekly report | Monthly report |
|---|---|---|
| Reader | Core team, project sponsor | Steering committee, executives, client |
| Length | A short email or half a page | 1 to 2 pages, or 8 to 10 slides |
| Looks at | Last 7 days, next 7 days | Trend, milestones, budget, forecast |
| Decisions | Unblock this week's work | Scope, money, dates |
MONTHLY PROJECT STATUS REPORT

Project: [Project name]
Month: [Month, year]
Prepared by: [Name, role]
Overall status: [GREEN / AMBER / RED]
Last month: [GREEN / AMBER / RED]

SUMMARY FOR EXECUTIVES
[3 sentences: where the project stands, what changed
since last month, what you need.]

STATUS TREND (this month / last month / reason)
Schedule: [G/A/R] / [G/A/R] / [reason for change]
Scope:    [G/A/R] / [G/A/R] / [reason for change]
Budget:   [G/A/R] / [G/A/R] / [reason for change]
Risk:     [G/A/R] / [G/A/R] / [reason for change]

MILESTONES (baseline date / forecast date / status)
[Milestone]: [date] / [date] / [done, on track, late]
[Milestone]: [date] / [date] / [done, on track, late]

BUDGET
Approved budget: [amount]
Spent to date: [amount]
Forecast at completion: [amount]
Variance: [amount, percent, reason]

CHANGE REQUESTS
[ID] - [description] - [effect on date and cost] -
[approved / pending / rejected]

TOP RISKS
[Risk] - [likelihood] - [impact] - [owner] - [mitigation]

NEXT MONTH
- [Milestone] - [owner] - [date]

DECISIONS NEEDED FROM THE STEERING COMMITTEE
- [Decision] - [by date]
The monthly version adds three things the weekly one skips: last month's status next to this month's, baseline dates next to forecast dates, and the change requests.
Executive, client, agile, and multi-project versions
The weekly and monthly templates cover most projects. For a different reader, keep the same order and change these parts.
| Version | Reader | What to change |
|---|---|---|
| Executive | Sponsor, leadership | Keep the overall status, summary, milestones, budget, and decisions. Cut the task lists. |
| Client | Client project lead | Add accepted deliverables, hours or fees against the budget, and items that wait for the client. Remove internal staffing notes. |
| Agile sprint | Product owner, team | Replace completed and planned work with the sprint goal, stories done against stories committed, and the next sprint goal. |
| Multi-project | PMO, portfolio owner | Use one row per project: overall status, next milestone, top risk, and ask. |
Project status report example
Here is the weekly template filled in for a made-up project, a customer portal migration. Use it to check the level of detail in your own report.
Subject: Customer portal migration weekly status: AMBER,
week ending Oct 2

Overall status: AMBER
Summary: Data migration finished two days early. The
payment vendor's sandbox API is two weeks late, but
go-live on Nov 16 holds if it arrives by Oct 12. We
need two decisions from you by Oct 9.

Status by area
Schedule: AMBER - integration test may start 1 week late
Scope:    AMBER - CR-14 (single sign-on) waits for approval
Budget:   GREEN - $184,000 spent of $200,000 planned to date
Risk:     AMBER - one vendor dependency on the critical path

Done this week
- Migrated all customer records with 0 failed validations
- Finished the account settings pages (design and build)
- Signed off the cutover runbook with IT operations

Planned next week
- Start the billing page build - Luis - Oct 5
- Security review of the login flow - Priya - Oct 8
- Vendor API delivery checkpoint - Dana - Oct 9

Blockers and risks
- Vendor sandbox API is late. Impact: integration test
  start slips from Oct 19 to Oct 26. Owner: Dana.
  Mitigation: build against a mock API from Oct 5.
- CR-14 is not approved. Impact: 6 days of work with no
  slot in the plan. Owner: sponsor.

Decisions needed
- Approve or reject CR-14 (single sign-on) - sponsor -
  by Oct 9
- Approve one contractor for 3 weeks of test automation -
  steering committee - by Oct 9

Key dates
- Integration test start: Oct 19 (at risk)
- User acceptance testing: Nov 2 (on track)
- Go-live: Nov 16 (on track)
Notice what the example does:
- The summary gives the good news, the top risk with the condition for the go-live date, and the ask in three sentences.
- Each amber line states its reason.
- Each decision has a person and a deadline.
How to fill in the template
A weekly report is quick to write when your tracker is up to date. Follow these steps in order.
- Pull the facts. Open your task tracker and list what closed this period and what is due next period.
- Rate each area. Compare schedule, scope, budget, and risk with your RAG thresholds. Write one reason per area.
- Set the overall status. Use your worst area.
- Write the summary last. State what changed, the top risk, and your ask. Then move it to the top.
- Turn activity into outcomes. "Checkout flow tested, 0 open defects" tells the reader more than "worked on testing".
- Add an owner and a date to every risk, plan item, and decision.
- Send it on the same day each week. A report that arrives on schedule gets read.
Status report formats: email, document, or slides
The content is the same in every format. The format depends on how the reader uses the report.
| Format | Best for | Length |
|---|---|---|
| Weekly update to the team and sponsor | One screen | |
| One-page document | Monthly report, client record, audit trail | 1 to 2 pages |
| Slide deck | Steering committee, client review, any live meeting | 8 to 10 slides |
| Dashboard | A portfolio of many projects | One row per project |
Use slides when you present the report and the room must make a decision. The next section gives you the outline.
Project status report template (8 slides)
Copy this order. Rename the slides to match your PMO language. The example headlines come from the customer portal report above.
| Slide | What goes on it | Example headline |
|---|---|---|
| 1. Title + reporting period | Project name, date range, presenter, overall RAG | Customer portal migration: week ending Oct 2 |
| 2. Executive summary | 3 to 5 bullets: headline outcome, top risk, one ask | Go-live holds for Nov 16 if the vendor API lands by Oct 12 |
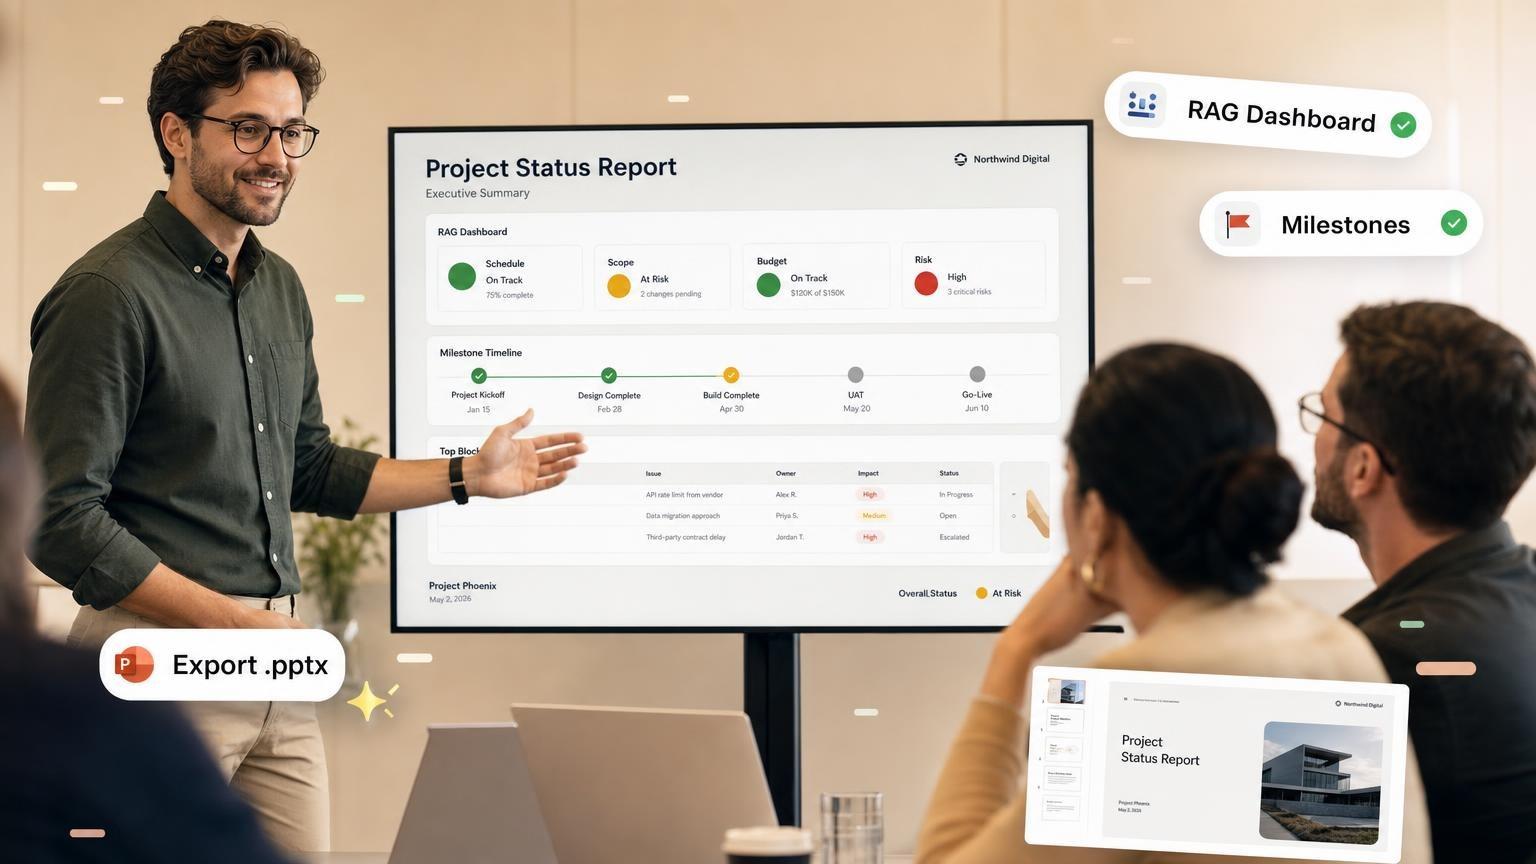
| 3. RAG dashboard | Schedule, scope, budget, risk: one color and one line each | Budget is green. Schedule, scope, and risk are amber. |
| 4. Progress since last report | Completed milestones, shipped work, metrics that moved | Data migration finished two days early |
| 5. Plan next period | Upcoming milestones, owners, target dates | Billing pages and security review start next week |
| 6. Risks and blockers | Issue, impact, owner, mitigation, escalation need | A late vendor API puts the test window at risk |
| 7. Budget and burn (optional) | Planned vs. actual, forecast, variance note | Spend is 8% under plan with no overrun forecast |
| 8. Decisions and asks | Explicit choices needed from leadership | Two decisions needed by Oct 9 |
Write each slide title as a full sentence that states the conclusion. A sponsor who reads only the eight titles gets the whole report.
Add slides 9 and 10 as an appendix when finance or legal need backup tables. Present the summary live. Leave the row-level tables in the appendix.
Slide 3: RAG dashboard example
| Area | Status | One-line note |
|---|---|---|
| Schedule | Amber | Integration test may start 1 week late. Go-live Nov 16 holds. |
| Scope | Amber | Change request CR-14 (single sign-on) waits for approval |
| Budget | Green | $184,000 spent of $200,000 planned. No overrun forecast. |
| Risk | Amber | Vendor sandbox API is two weeks late. Mock API from Oct 5. |
Color the status cells on the slide, and keep the word next to the color. Some readers cannot tell red from green, and a printed copy can be black and white.
If the vendor misses Oct 12 in this example, schedule turns red: the team cannot hold the go-live date without a sponsor decision.
Define RAG once in your PMO wiki. Reuse the same thresholds each week. When the labels change from week to week, sponsors trust the dashboard less than an honest red status.
Slide 6: Blockers that earn a slide
List only the blockers that need action outside the team:
- Vendor contract unsigned: legal review stalled for 10 days
- Headcount not approved: a critical-path role is open
- Dependency team missed a handoff: QA cannot start
For each one, show the impact, the owner, and the help you need. Put everything else in the speaker notes or behind the tracker link.
Build the deck from a written status report
You have the content in an email, Notion, or a Word export. You do not need to retype the bullets slide by slide.
Manual path
- Drop each section from your status report into the matching slide of the 8-slide outline
- Replace paragraphs with a headline and a maximum of 3 bullets per slide
- Add PowerPoint speaker notes for the numbers and names you might forget under pressure
- Save or share as
.pptxfor stakeholders on Microsoft 365
AI path (GenPPT)
- Upload your status PDF or Word document, or paste the weekly update, in GenPPT
- Prompt: "Turn this into a 10-slide project status report for executives. Include a RAG dashboard, milestones, blockers, and decisions needed."
- GenPPT drafts an outline. Edit it and approve it before the design runs.
- Pick a visual concept. The slides generate in about 2 to 3 minutes.
- Change slides in chat, then export
.pptxor PDF - Check the dates, RAG colors, and dollar figures against your tracker before you present
Two limits to know. GenPPT slides are full-slide designs, so a budget chart is not linked to Excel and does not update when your spreadsheet changes. The AI can also restate a number incorrectly, so verify each one.
GenPPT has no free plan. The trial costs $1 for 3 days of full access, and you need a card.
After the trial it is $25 per month or $99 per year, with 20 decks per month and watermark-free PowerPoint and PDF export. See pricing.
For the full workflow, see How to Create a PowerPoint with AI. If your report is already a PDF, read PDF to PowerPoint with AI.
Status deck prompts you can start from
Tap one to start a deck with that topic. Add your project facts in the next step.
- Weekly project status report for a website migrationCreate
- Monthly steering committee update for an ERP rolloutCreate
- Client status report for a mobile app buildCreate
- Sprint review status deck for a product teamCreate
- Monthly status report for a construction projectCreate
- Quarterly program status update for executivesCreate
Common mistakes
| Mistake | Fix |
|---|---|
| Every task on one slide | One milestone theme per slide. Link to the tracker for task-level detail. |
| RAG all green when blockers exist | Rate each area on the worst credible view. Explain amber and red in one line. |
| Activity instead of outcomes | Write what is finished and what it changed, not what the team worked on. |
| A risk with no owner or date | Add a name and a deadline to every risk and mitigation. |
| No explicit ask | End with decisions: approve the change request, fund a contractor, accept a date slip. |
| Rebuilding from scratch weekly | Keep the section order fixed. Swap the content only. |
| Skipping rehearsal | Read the blockers and asks aloud. Cut slides if you run over time. |
The second mistake has a name: a watermelon project. It is green on the outside and red on the inside, and the sponsor finds out too late to help.
Frequently asked questions
What should a project status report include?
Include the project name and reporting period, an overall status, a two to three sentence summary, work completed, work planned, risks and blockers, and the decisions you need. Add budget and milestone dates when the reader approves money or deadlines. Every item needs an owner and a date.
How often should you send a project status report?
Send a weekly report to the core team and the sponsor on most active projects. Send a monthly report to the steering committee or executives, who need the trend more than the detail. Use a daily update only during a launch, a cutover, or an incident.
How many slides should a project status report have?
Use 8 to 10 slides for a 15 to 20 minute executive readout. An internal team update can run 5 to 6 slides if you skip the budget and the appendix.
What is RAG in project reporting?
RAG means red, amber, green: a traffic-light status for schedule, scope, budget, or risk. Green means on track, and amber means at risk with a recovery plan. Red means the project needs a decision or help from outside the team. Define the thresholds once and apply them the same way each week.
Can I use Google Slides instead of PowerPoint?
Yes. The same 8-slide outline works in Google Slides, and Google Slides opens .pptx files. If your organization uses both, see Google Slides vs PowerPoint before you pick a primary editor.
Can AI build a status report from my Jira export?
Yes, if you give it readable text: a written summary, a PDF, or a Word file. A raw list of tickets makes a weak deck, so write the summary and the RAG ratings first. AI restructures your prose into slides, but you still own the RAG ratings, dates, owners, and dollar amounts. Verify each one before you present.
Where do detailed metrics go?
Put them in appendix slides or speaker notes. The live deck stays easy to scan. When a sponsor asks a follow-up question, you open the appendix table.
Ship this week's readout
Copy the weekly template, fill in the brackets from your tracker, and send it today. That is your report.
If you present it to a steering committee, map each section to the 8-slide outline. Or upload the written report to GenPPT, approve the outline, and export PowerPoint before the meeting.