
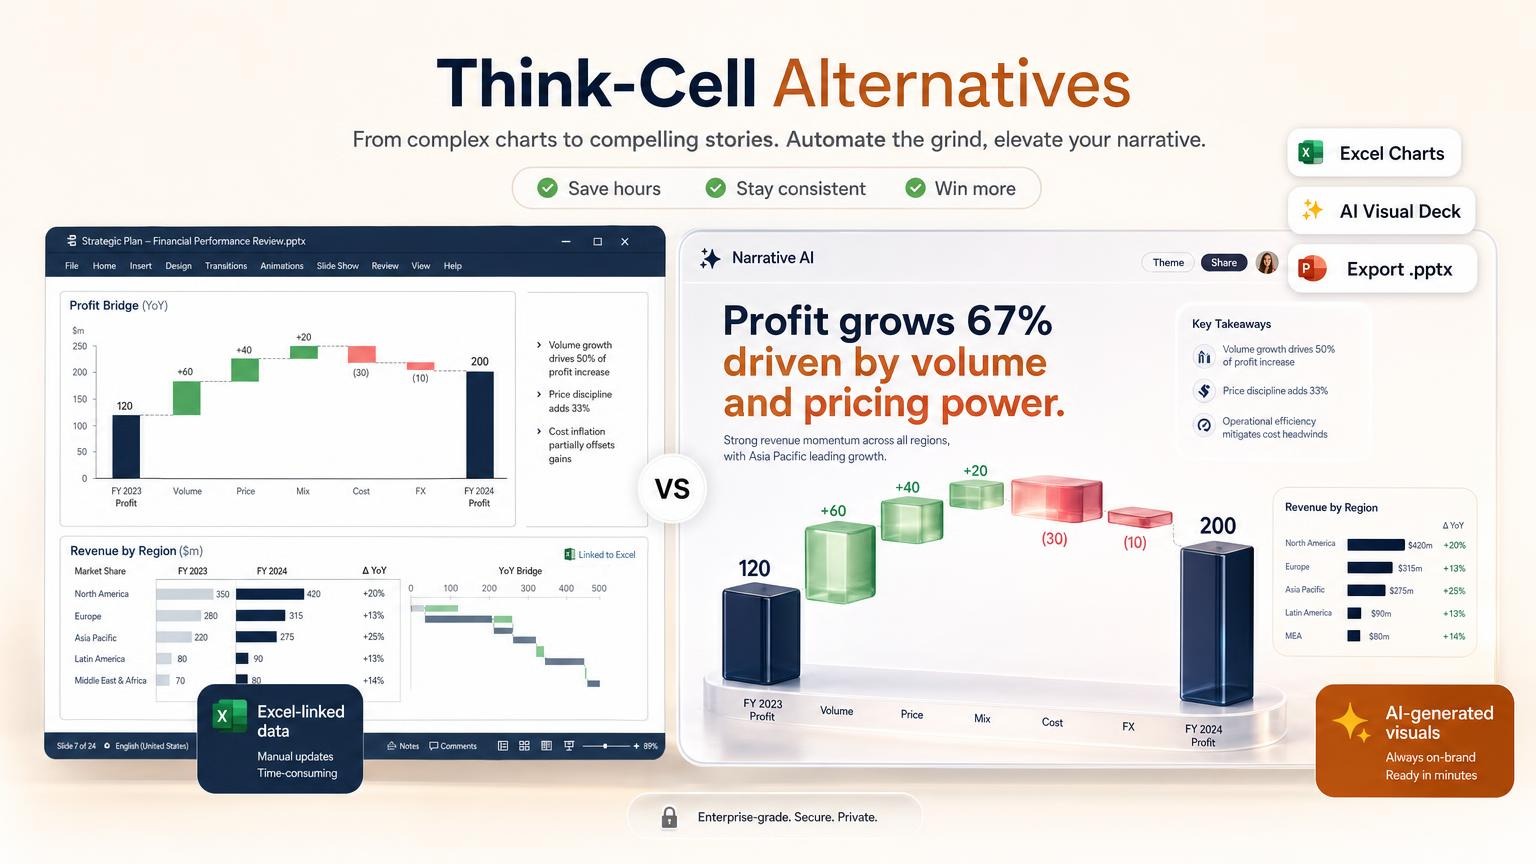
The best think-cell alternatives depend on the job. For Excel-linked Mekko and waterfall charts, use Mekko Graphics or empower Charts. For Google Slides, use Vizzlo or Chartbuddy.
For a free option, use the chart types that PowerPoint already has. For a narrative deck from a written report, use an AI deck builder such as GenPPT.
No tool is a drop-in copy of think-cell. Some cost less per seat, but each one changes the chart set, the platform, or the Excel link. First decide where you lose time: on data-linked charts, or on the story around them.
What is think-cell?
think-cell is an add-in for desktop PowerPoint and Excel. It adds chart types that PowerPoint does not have, links them to Excel ranges, and automates slide layout. The vendor now writes the name as "thinkcell".
The Suite plan, the one that most people mean when they say think-cell, includes these items according to the think-cell pricing page:
- 40+ chart types, including waterfall, Gantt, and Mekko
- Excel links. You change the workbook, and the chart on the slide updates
- Annotations and text boxes that update automatically when the data changes
- Layout tools, agenda slides that follow the deck structure, and a library of 450+ slide templates and elements
The files stay normal PowerPoint files. The think-cell manual says that people without the add-in can open and edit them, and that the elements show as regular shapes and chart objects.
think-cell pricing in 2026
think-cell publishes its prices. The old "quote only" answer is out of date. On October 2, 2026 the pricing page showed four plans in US dollars, per user per month, billed annually:
| Plan | Per user per month | Per year (1 user) | What it adds |
|---|---|---|---|
| Essentials | $8.90 | $106.80 | Layout tools, templates, image library. No think-cell charts |
| Suite | $28.60 | $343.20 | 40+ chart types and Excel links |
| AI Suite | $46.54 | $558.48 | AI chat for slides, AI Excel analysis, translation |
| AI Suite Plus | $97.60 | $1,171.20 | 5x the AI tokens |
What to know before you budget:
- These prices are for 1 to 4 users. The Suite price falls with volume: $25.40 at 5 users, $24.20 at 10, $22.10 at 25, and $20.60 at 50. Above 50 users, you contact sales.
- Billing is annual. The page shows no month-to-month option.
- The price can change with your country and currency. Some third-party sites quote other figures. Trust the number that the checkout shows you.
- The trial needs no credit card and stops by itself. The trial page does not state the length. 30 days is the reported length, and we did not verify it.
- Students and teaching staff can get think-cell at no cost through the academic program. There is also a startup program.
So think-cell is not the most expensive chart add-in. A single Mekko Graphics license costs more ($399 per year). empower Express Lite costs less ($131.89 per year), but it runs on Windows only.
The cost problem is the number of seats. Every person who builds or updates a chart needs a license.
Does think-cell work on Mac or Google Slides?
Mac: yes. The think-cell installation manual lists macOS Big Sur (11) or later with Office 2019, 2021, or 2024 for Mac, or the installed Microsoft 365 desktop apps.
Windows: yes. It supports Office 2013 through 2024 and the Microsoft 365 desktop apps.
Google Slides: no. The system requirements list only desktop PowerPoint and Excel. Google Slides and PowerPoint for the web are not on the list.
If your team works in Google Slides, you have two routes:
- Vizzlo has an add-on for Google Slides and an add-in for PowerPoint. See the Vizzlo section.
- Chartbuddy has a Chrome extension for Google Slides and an add-in for PowerPoint. Its 14 chart types include waterfall, Marimekko, and bar Mekko charts, and they sync with Google Sheets. Chartbuddy gives you 10 sessions at no cost, then costs $12 per seat per month or $120 per year.
Which think-cell alternatives run on Mac?
If you look for an alternative because of your Mac, check the platform before the price. This is what each vendor lists:
- Mekko Graphics: a PowerPoint add-in for Mac, but no Excel add-in for Mac
- Zebra BI for Office: Office for Mac is on the supported list
- Vizzlo and AECharts: both run in the browser
- Lucen Timeline: the add-in is for Windows. The separate browser version works on a Mac
- Windows only: empower Charts and Power-user. The empower Express plan for Mac does not include chart creation
Quick comparison: Think-Cell alternatives at a glance
| Tool | Best for | Excel-linked charts | Starting price (Oct 2026) |
|---|---|---|---|
| think-cell Suite | Consulting chart automation | Yes | $28.60/user/mo, billed annually |
| Native PowerPoint | Editable charts, no extra software | Manual paste link | Included with Microsoft 365 |
| Mekko Graphics | Mekko, cascade, and Gantt charts | Yes (Windows) | $399/user/yr |
| empower Charts | Windows teams and company-wide rollouts | Yes | $11.99/user/mo (Express Lite) |
| Vizzlo | Google Slides and browser work | Excel and CSV upload | $19/mo |
| Lucen Timeline | Gantt charts and timelines | Excel import on Plus | $9/mo, billed annually |
| Zebra BI for Office | Variance and finance reports | Yes | $816/yr for up to 10 users |
| Plus AI | AI drafts inside PowerPoint or Slides | No | $10/user/mo, billed annually |
| Beautiful.ai | Smart templates and brand kits | No | $14.50/mo, billed annually |
| GenPPT | Full-slide AI decks from briefs and documents | No | $1 trial, then $25/mo |
For a wider AI presentation roundup, see Best AI PowerPoint Generators in 2026.
What Think-Cell actually does (and why consultants pay for it)
think-cell is a PowerPoint and Excel add-in for Windows and Mac, made for finance and strategy work. You connect Excel ranges to chart objects in PowerPoint. When the workbook changes, the waterfall bridges, stacked columns, and Gantt timelines on the slide update.
Where think-cell is hard to match:
- Excel-linked updates. You do not rebuild charts by hand
- Specialized chart types: waterfall, Mekko (Marimekko), Gantt, and scatter charts with labels, in the format that consulting firms use
- Agenda and layout automation for long decks
- Speed for analysts who build the same chart patterns each week
Limits:
- Annual per-seat subscription. $28.60 per user per month for the Suite, billed annually. The pricing page shows no monthly billing.
- Desktop PowerPoint only. It runs on Windows and Mac. It does not run in Google Slides.
- AI costs more. Slide building in an AI chat is in the AI Suite at $46.54 per user per month. The Suite does not write your storyline.
- A learning curve. The speed comes with repeated use. The first sessions can feel slow.
If you turn an Excel model into 40 linked charts, think-cell remains the benchmark. The tools below solve parts of that job, or a different job.
How we evaluated these Think-Cell alternatives
We compared the tools against the questions that consulting and corporate strategy teams ask when they look for a replacement:
- Chart depth: Does it make waterfall, Gantt, and Mekko charts, or only bar, line, and pie charts?
- Excel relationship: A live link, a one-time import, or no spreadsheet path?
- PowerPoint fit: A native add-in, a clean
.pptxexport, or web only? - Platform: Windows, Mac, Google Slides, or the browser?
- Edit model: Chart objects that you can edit, or full-slide images?
- Pricing clarity: Public prices or a sales quote?
We did not run a sponsored benchmark. We read every price on the vendor's official page on October 2, 2026. Where a vendor does not publish a price, the text says so.
When Think-Cell still wins
Stay on think-cell if:
- Your deck must refresh from Excel before each client meeting
- You build Mekko, waterfall, or Gantt charts to firm formatting standards
- Your organization already owns licenses and templates that use the add-in
- Compliance or IT policy requires native PowerPoint objects, not exported images
Look at alternatives when:
- You need first drafts from PDFs, memos, or prompts more than a live model link
- Your charts are simple (bar, line, pie), and native PowerPoint is fast enough
- Your team works in Google Slides, where think-cell does not run
- Only a few people build charts, and a license for every seat is hard to justify
If the first item is your case, a deck builder fits better than a chart add-in. It will not link your charts to Excel.
Best think-cell alternative by use case
Find your situation in the first column. Each pick has a section below with its limits.
| Your need | Best pick | Why | Price |
|---|---|---|---|
| Excel-linked Mekko and waterfall charts | Mekko Graphics | Marimekko, bar Mekko, cascade, and Gantt charts with an Excel add-in | $399/user/yr, from $249 at 4+ users |
| Excel-linked charts on Windows at a lower price | empower Charts | 40+ chart types, Excel links, and conversion of charts from other add-ins | Express Lite $11.99/user/mo. Quote for large rollouts |
| Charts in Google Slides | Vizzlo or Chartbuddy | Both work inside Google Slides | $19/mo or $12/seat/mo |
| Gantt charts and roadmaps only | Lucen Timeline | A PowerPoint add-in for timelines (the product was Office Timeline) | Free up to 10 items, then from $9/mo |
| Finance variance reports | Zebra BI for Office | Waterfall and variance charts that link PowerPoint to Excel | $816/yr for up to 10 users |
| No budget | Native PowerPoint | A built-in waterfall chart and editable chart objects | Included with Microsoft 365 |
| AI drafts inside PowerPoint | Plus AI | An add-in for PowerPoint and Google Slides | $10/user/mo, billed annually |
| A deck from a written report | GenPPT | Outline first, then designed slides. No Excel link | $1 trial, then $25/mo |
If a row says "Excel-linked" and your charts change each week, stay in the first two rows. The AI tools at the bottom do a different job.
The best Think-Cell alternatives in 2026
The numbers below are labels, not a quality ranking. Options 1 to 4 change the workflow. Options 5 to 9 are chart tools that replace think-cell more directly.
1. Native PowerPoint charts: free built-in option
Best for: Teams that need editable chart objects in PowerPoint without another subscription.
Tradeoffs: You format everything by hand. Microsoft's list of chart types in Office includes a waterfall chart.
The list does not include a Gantt chart or a Mekko chart. You make those from stacked bars or from a template.
How it works:
- Select Insert > Chart, pick a chart type, and paste your numbers into the data sheet that opens
- Use Chart Design and Format to apply your colors and labels
- For a bridge chart, pick the Waterfall chart type
- To keep a link to Excel, copy the chart in Excel and paste it into PowerPoint with a link data paste option. Keep the workbook in the same location
Good fit: Internal QBRs, simple client decks, and teams with strong PowerPoint operators who do not need a Mekko chart each week.
Not ideal if: You rebuild complex bridges each day, or you maintain an agenda across 100 slides.
2. Beautiful.ai: best for brand-consistent smart slides
Best for: Marketing, sales, and operations teams that build slide by slide with automatic formatting and brand kits.
Tradeoffs: You build one slide at a time with AI help. Excel does not stay linked. The charts suit business decks, not consulting-grade Mekko or Gantt charts.
Pricing (October 2026): Beautiful.ai lists Pro at $14.50 per month, billed annually, and a $45 monthly option for single projects. The Team plan is $40 per user per month billed annually, or $50 billed monthly. There is a 14-day trial.
Good fit: On-brand proposals, enablement decks, and recurring reports where layout consistency matters more than a refresh from a model.
Not ideal if: Your work starts in Excel and ends with a linked waterfall update the night before the readout.
For more options in this category, see Best Beautiful.ai Alternatives.
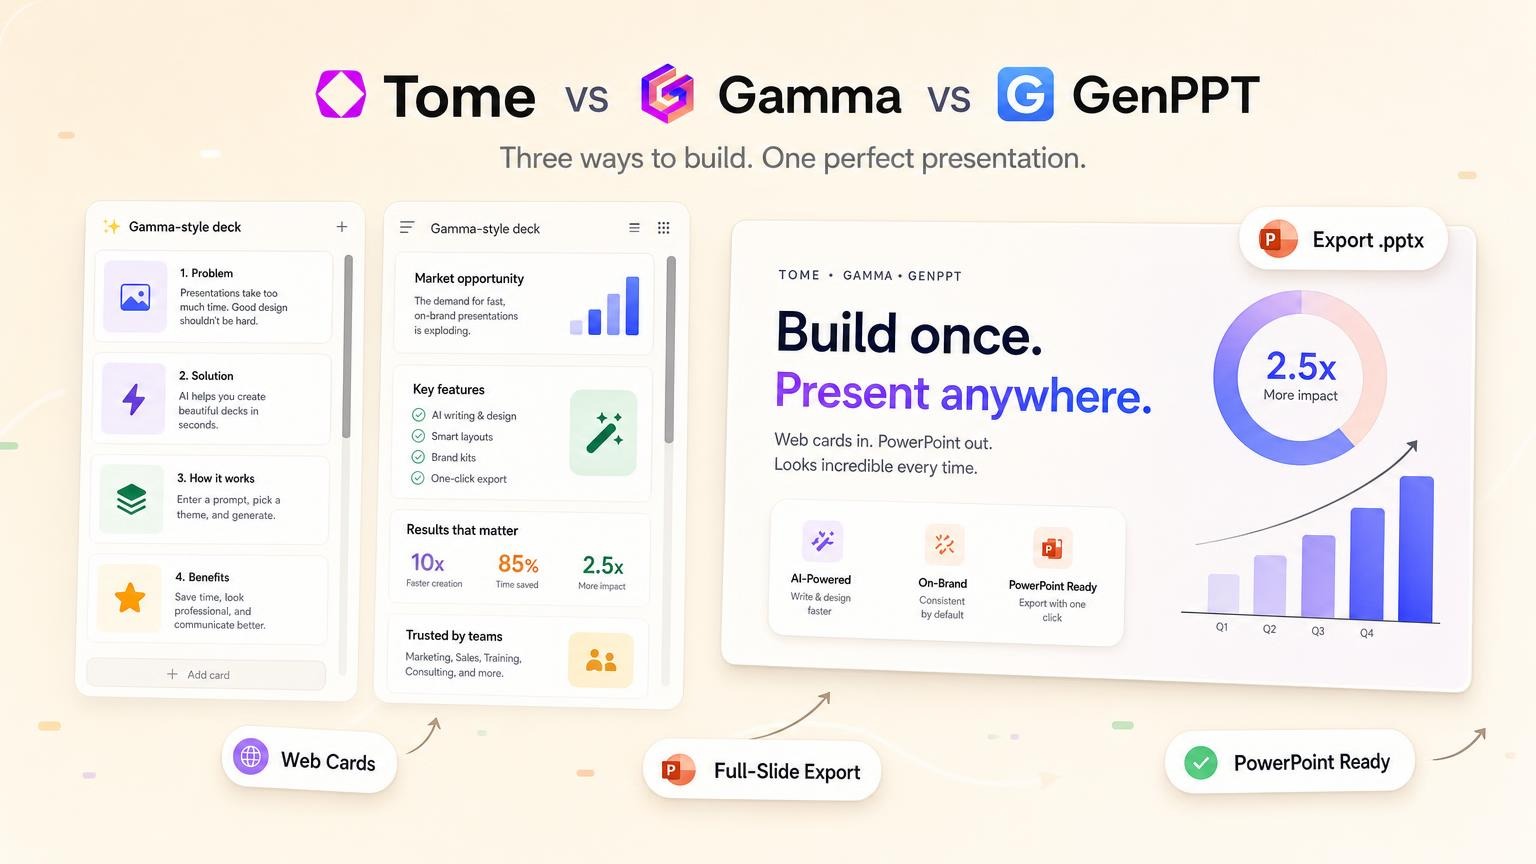
3. GenPPT: best for visual narrative decks (not Excel sync)
Best for: Consultants and operators who have summarized findings in a PDF, a Word document, a brief, or a prompt, and who need a designed deck.
Tradeoffs: GenPPT is not a chart add-in, and it does not replace think-cell for Excel-linked charts. It does not connect to a workbook, and it does not refresh when cells change.
The slides are image-native, full-slide designs. You change a slide in chat, then export .pptx or PDF. Check each number against your source.
Pricing (October 2026):
- Trial: $1 for 3 days of full access, card required
- After the trial: $25 per month or $99 per year. Paid plans include 20 decks per month and
.pptxand PDF export with no watermark (see pricing)
Where GenPPT fits vs Think-Cell:
| Job | Think-Cell | GenPPT |
|---|---|---|
| Refresh charts from Excel | Yes | No |
| Build a storyline from a PDF or memo | Manual (AI Suite adds an AI chat) | Yes, with outline approval first |
| Mekko and Gantt automation | Strong | No. Charts are part of the slide design |
| Editable chart objects in PowerPoint | Yes | No. Slides export as full-slide designs |
| Speed to a first draft | Fast if the data is ready | About 2 to 3 minutes after you approve the outline |
Typical GenPPT workflow:
- Start from a prompt, a PDF, a Word document, a text file, images, or a link
- GenPPT researches the topic and drafts an outline. Approve the outline or change it first
- Pick a visual concept
- GenPPT generates the slides. Edit a slide in chat if the copy or the layout is not right
- Export to PowerPoint or PDF. The
.pptxfile opens in PowerPoint, Google Slides, and Keynote
Good fit: Strategy readouts from written reports, workshop decks, pitch narratives, and PDF-to-PowerPoint work where the input is prose, not a live model.
Not ideal if: You need an Excel refresh each night, editable Mekko objects, or think-cell templates that IT requires.
Consulting decks need more than charts. For action titles and one message per slide, read how McKinsey slides are built, or start from the McKinsey slide generator.
Deck topics that fit this workflow:
- Market entry strategy readout for a mid-size retailerCreate
- Quarterly business review for a SaaS productCreate
- Cost reduction program findings and recommendationsCreate
- Competitor landscape summary for the boardCreate
4. Plus AI: best AI add-in inside PowerPoint & Google Slides
Best for: Teams whose policy requires work inside PowerPoint or Google Slides, and who want AI to draft slides and rewrite bullets without a separate web app.
Tradeoffs: Plus AI speeds up content and layout. It does not have think-cell's Excel-linked chart engine, and it does not make Mekko or Gantt charts from a model. Use it to draft slides, not to refresh bridges.
Pricing (October 2026): Plus AI lists Basic at $10 per user per month billed annually, or $15 billed monthly. Pro is $20 (annual) or $25 (monthly), and Team is $30 (annual) or $40 (monthly). There is a 7-day trial.
Good fit: Corporate teams on Microsoft 365 or Google Workspace who want AI drafts without an export step.
Not ideal if: Chart automation from Excel is the primary job.
See Plus AI in context in our AI PowerPoint generator comparison.
5. Mekko Graphics: closest match for Mekko and waterfall charts
Best for: Analysts who want the think-cell chart set (Mekko, cascade, Gantt) from a specialist add-in.
What it does: Mekko Graphics lists Marimekko, bar Mekko, cascade (waterfall), bubble, scatter, bar, line, area, and Gantt charts. It has a PowerPoint add-in and an Excel add-in.
Tradeoffs: The Excel add-in is for Windows only. The vendor's FAQ says Mac users get the PowerPoint add-in but no Excel add-in. A single license also costs more than think-cell Suite.
Pricing (October 2026): $399 per user per year for one user, with renewal at $299. Volume prices start at $249 per user per year for 4 licenses, and 101 or more users pay $149 each. There is a 30-day trial.
Good fit: Teams of four or more on Windows whose main need is Mekko and cascade charts.
Not ideal if: You buy one seat to save money, or your analysts are on Mac and need the Excel link.
6. empower Charts: best for enterprise rollouts
Best for: Large companies that want one vendor for charts, templates, and brand control in Microsoft 365. Small Windows teams can buy the same chart tool on the Express plan.
What it does: empower Charts is a PowerPoint add-in with more than 40 chart types, including waterfall, Gantt, and Mekko. Charts, tables, and text boxes link to Excel.
The vendor says the links stay intact when you move the file, and that charts from other add-ins convert in one click.
Tradeoffs: The vendor lists Windows, Citrix, and Terminal Server. It does not list macOS for the chart tool, and the Express plan for Mac leaves out chart creation.
Pricing (October 2026): There are two routes. Large rollouts get a quote. For smaller teams, empower Express lists the Lite plan (chart creation) at $11.99 per user per month, or $131.89 per user per year.
The Full plan adds the slide library and brand checks for $35.99 per user per month. Both plans have a 30-day trial.
Good fit: A company-wide switch from think-cell where IT wants central control, or a Windows team that wants Excel-linked charts for less than think-cell Suite.
Not ideal if: Your analysts are on Mac.
7. Vizzlo: best for Google Slides and browser work
Best for: Teams in Google Slides, or mixed teams that use PowerPoint and Slides.
What it does: Vizzlo makes more than 120 chart types in the browser, including waterfall, Gantt, and Marimekko charts. Paid plans include a PowerPoint add-in and a Google Slides add-on. You paste data, upload a CSV or Excel file, or connect a Google Sheet.
Tradeoffs: It is a chart builder, not a slide layout tool. An uploaded Excel file is not the same as think-cell's live link to a workbook.
Pricing (October 2026): A free plan with a watermark on the charts. Professional is $19 per month, and Teams is $69 per month for 5 seats. Paid plans start with a 14-day trial that needs a card.
Good fit: Google Workspace teams that need a waterfall or Mekko chart a few times per month.
Not ideal if: You refresh 40 linked charts from one model.
8. Lucen Timeline: best for Gantt charts only
Best for: Project managers who used think-cell only for Gantt charts.
What it does: Lucen Timeline is the new name of Office Timeline. It is a PowerPoint add-in for Windows that builds Gantt charts, timelines, and swimlanes. A browser version is sold separately.
Tradeoffs: It makes timelines only. It has no waterfall or Mekko charts.
Pricing (October 2026): The Lucen Timeline pricing page lists a free edition with a limit of 10 items per timeline. Lite is $9 per user per month, Plus is $17, and Expert is $21, all billed annually. Excel import starts on Plus.
Good fit: Roadmaps, project plans, and status decks.
Not ideal if: You need financial charts.
9. Zebra BI for Office: best for finance variance reports
Best for: FP&A teams that report actual against plan each month.
What it does: Zebra BI for Office adds waterfall, variance, and small-multiple charts to Excel and PowerPoint. It calculates the variances, and it links PowerPoint visuals to data in Excel. The vendor lists Office 2021, Microsoft 365, and Office for Mac.
Tradeoffs: The focus is reporting, not consulting slides. It has no Mekko or Gantt charts on its feature list. Plans come in packs of users, not single seats.
Pricing (October 2026): A free version for personal use by one user. The Starter plan is $816 per year for up to 10 users ($68 per month, billed annually), with a first-year discount for new customers. The Business plan is $3,792 per year for up to 50 users.
Good fit: Monthly management reports with variance bridges.
Not ideal if: You need one seat for strategy decks.
Also consider: Power-user is a Windows add-in for PowerPoint, Excel, and Word with Mekko, Gantt, and Excel-linked charts. Its plans page shows no public price and says "not Mac yet". Software listing sites report 240 euros per user per year, and we did not verify that number.
Ampler Charts is a standalone charting add-in for PowerPoint. Ampler's pricing page lists it at 12 euros per month.
Free think-cell alternatives
No free tool gives you think-cell's full chart set with a live Excel link and no watermark. These are the free routes and their limits.
| Free option | What you get | The limit |
|---|---|---|
| Native PowerPoint | Waterfall chart, editable chart objects | No Mekko or Gantt chart type |
| think-cell academic program | think-cell for students and teaching staff | Academic use only |
| Vizzlo free plan | 100+ chart types in the browser | Watermark, no add-ins |
| AECharts free plan | Waterfall, Mekko, and Gantt charts in the browser | Watermark on exports |
| Lucen Timeline free edition | Gantt charts in PowerPoint | 10 items per timeline |
| Zebra BI for Office free version | Waterfall and variance charts | Personal use, one user |
| Chartbuddy | Waterfall and Mekko charts in Google Slides and PowerPoint | 10 sessions, then paid |
| Power-user academic version | A version for students and teachers | Windows only |
AECharts removes the watermark on its Pro plan at $10 per month, billed yearly.
If you are a student, start with the think-cell academic program. If you are a freelancer with a few charts per month, start with native PowerPoint and add a browser tool for the Mekko chart.
How to make waterfall, Mekko, and Gantt charts without think-cell
You can build all three in plain PowerPoint. Only the waterfall is quick.
Waterfall chart
- Select Insert > Chart > Waterfall
- Enter the start value, each change (positive or negative), and the end value
- Right-click the start bar and the end bar, and select Set as Total
- Add data labels, then set the colors for increase, decrease, and total
Mekko chart (workaround)
- Insert a 100% stacked column chart
- Repeat each category in proportion to its width. A category that is 30% of the market gets 3 columns out of 10
- Set the gap width to 0% so the repeated columns touch
- Add the category labels as text boxes
This breaks when the data changes. If you need a Mekko chart more than once per quarter, a chart add-in pays for itself.
Gantt chart (workaround)
- Insert a stacked bar chart with two series: start date and duration
- Set the start series to No Fill so only the duration bars show
- Reverse the category axis so the first task is at the top
- Add milestones as shapes
What about Power BI, ChatGPT, and other AI chart tools?
Some lists put think-cell next to Power BI, ChatGPT, or standalone chart generators. Those tools help you explore and visualize data. The chart then goes into a slide as an image or an embedded report.
That is a different job:
- Power BI: dashboards and deep analysis. Microsoft's Power BI add-in for PowerPoint puts a live report page or visual on a slide. Viewers need Power BI access, and the visual is not an editable PowerPoint chart
- ChatGPT: charts from files that you upload. You download the chart and place it in a slide, and it has no link to your workbook
- think-cell: live charts inside PowerPoint that are tied to Excel
Use BI or chat tools when you need analysis. Keep think-cell, or a chart add-in from the list above, when you need linked charts in consulting format. Use GenPPT when you need a designed deck from a written source.
How to switch from think-cell without breaking your slides
Do these steps before the renewal date. think-cell bills annually, so the renewal is the natural moment to change.
- List the chart types in your last five decks. If Mekko or Gantt charts appear each week, you need a chart add-in, not an AI tool
- Count who builds charts and who only edits text. People without the add-in can open and edit the files, so they do not need a license
- Run the trial of the replacement on one real deck. Rebuild your three hardest charts
- Test the Excel link. Move the workbook, rename a sheet, and update the chart
- Leave old decks as they are. Without the add-in, think-cell elements show as regular PowerPoint shapes and chart objects. The smart behavior does not work until someone opens the file with think-cell again
- Decide by seats, not by list price. Five builders on think-cell Suite cost $1,524 per year at $25.40 per user per month
How to choose the right Think-Cell alternative
| Your priority | Start here |
|---|---|
| Excel-linked waterfall, Mekko, and Gantt charts | think-cell, or Mekko Graphics and empower Charts as direct replacements |
| Charts inside Google Slides | Vizzlo or Chartbuddy |
| Gantt charts and roadmaps only | Lucen Timeline |
| Finance variance reports | Zebra BI for Office |
| AI drafts inside PowerPoint | Plus AI |
| Brand-smart slides that you build by hand | Beautiful.ai |
| A narrative deck from a PDF, brief, or prompt | GenPPT |
| Editable chart objects at no extra cost | Native PowerPoint |
| Live dashboards before slides | Power BI (export the visuals) |
Before you switch, answer one question: Must the chart update when Excel changes, or do you need a deck tomorrow from a report that is already written? The first path keeps think-cell or a chart add-in. The second path fits an AI deck builder.
Frequently asked questions
What is the best Think-Cell alternative in 2026?
It depends on the job. Mekko Graphics and empower Charts are the closest for Excel-linked consulting charts, and Vizzlo and Chartbuddy cover Google Slides. Native PowerPoint is the option with no extra cost. GenPPT fits narrative decks from documents or prompts, not a live Excel link.
Can GenPPT replace Think-Cell?
Not for Excel-linked chart automation. GenPPT is not a chart add-in. It does not connect to workbooks, and it does not refresh charts when cells change. It fits when you have a PDF, a brief, or an outline and want designed slides that you export to PowerPoint.
Does GenPPT link to Excel?
No. GenPPT starts from a prompt, a PDF, a Word document, a text file, images, or a link. Its slides are image-native designs, so check every number against your source. For charts that follow a model, use think-cell, a chart add-in, or PowerPoint's linked data.
Is Think-Cell worth it in 2026?
Yes, for people who build many linked, specialized charts to a deadline. At $343.20 per year for one Suite user, it costs less than a single Mekko Graphics license. It is hard to justify if your decks are mostly narrative, your charts are simple, or you rarely update numbers from Excel.
How much does Think-Cell cost?
On October 2, 2026, the think-cell pricing page showed the Suite at $28.60 per user per month, billed annually, for 1 to 4 users. That is $343.20 per year. Essentials is $8.90, AI Suite is $46.54, and AI Suite Plus is $97.60 per user per month. Volume prices are lower, and the price can change with your country.
Can PowerPoint make waterfall charts without Think-Cell?
Yes. PowerPoint has a Waterfall chart type. Select Insert, then Chart, then Waterfall, and set the first and last bars as totals. PowerPoint has no Mekko or Gantt chart type, so those need a workaround or an add-in.
Which alternative exports clean PowerPoint files?
Mekko Graphics, empower Charts, and Plus AI work inside PowerPoint, so there is no export step. Beautiful.ai and GenPPT export .pptx files. GenPPT slides are full-slide designs, not separate chart objects that you can edit. Native PowerPoint gives you editable chart objects.
Conclusion: match the tool to the bottleneck
think-cell owns one job: Excel data to consulting-grade charts inside PowerPoint, fast. At $28.60 per user per month, it is also not the most expensive tool in its class.
If you need the same charts for less money per team, test empower Express Lite on Windows, or Mekko Graphics at four or more seats. If you work in Google Slides, test Vizzlo or Chartbuddy. If you need a few charts per month, native PowerPoint is enough.
If your deck starts from a written report and you want designed slides with outline control first, try GenPPT. It does not link charts to your model.
For more AI tool comparisons, read Best AI PowerPoint Generators in 2026. For document uploads, see How to Turn a PDF into a PowerPoint with AI.