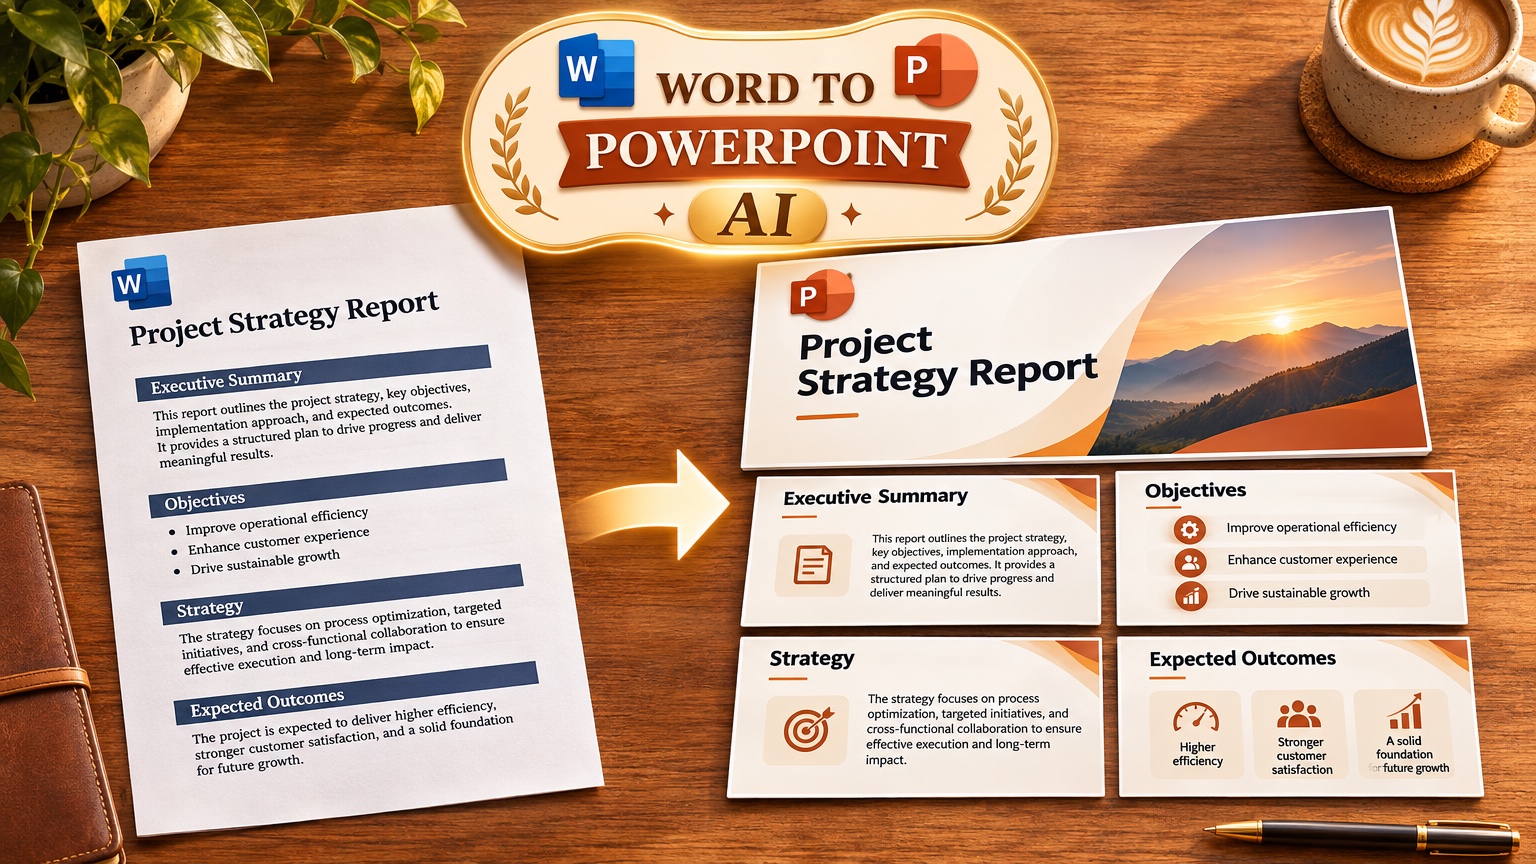
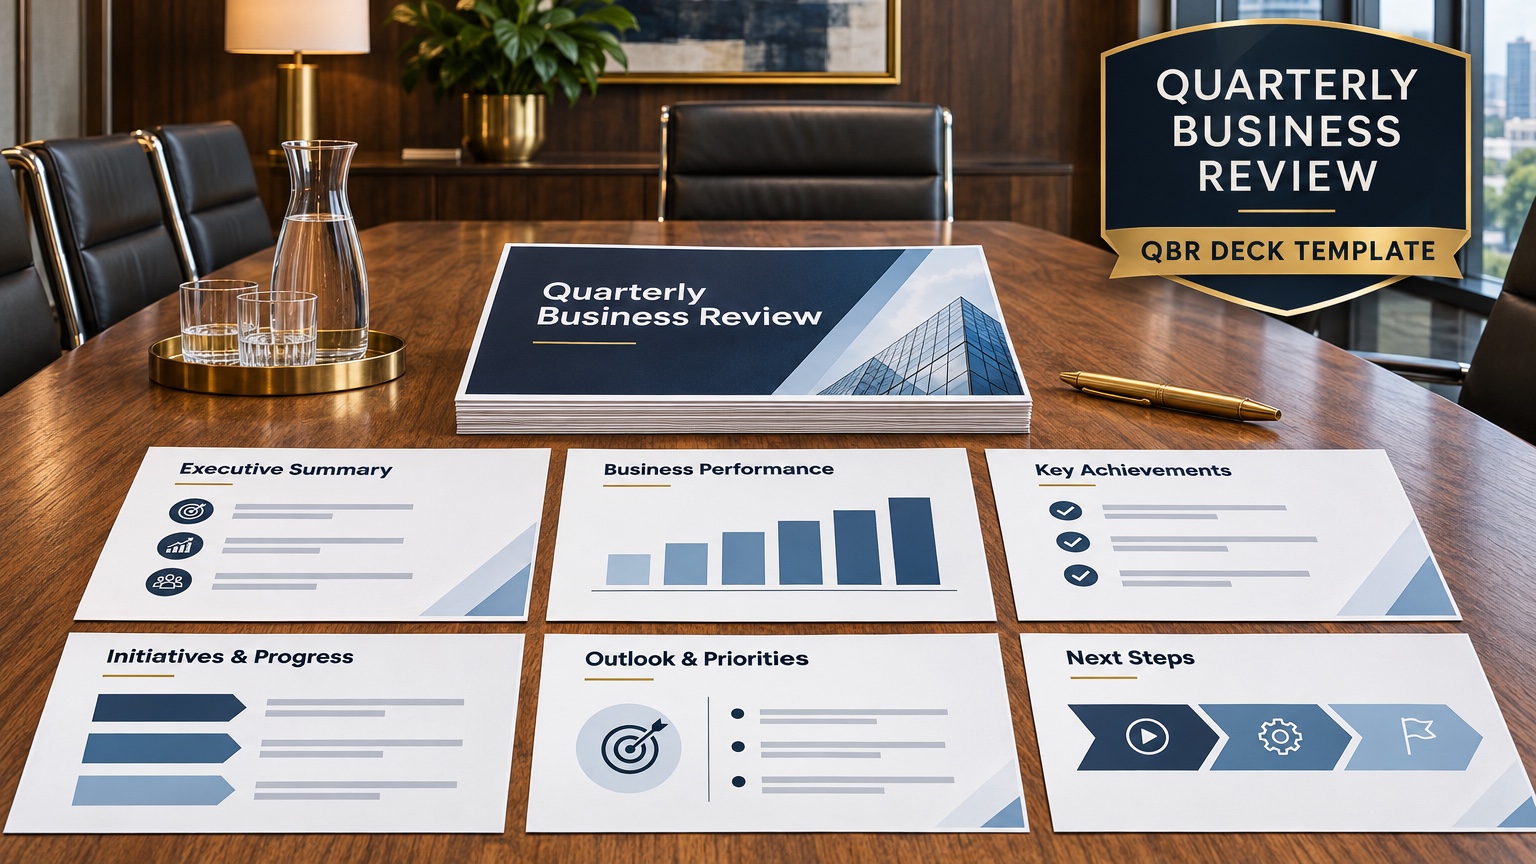
A quarterly business review (QBR) works best at 8 to 10 slides: executive summary, results against goals, misses, risks, next quarter's plan, and one decision. GenPPT decks have a 10-slide median and 46% run 6 to 10 slides (1,034 generated decks, 3 Aug to 11 Oct 2026).
The three public decks on the GenPPT quarterly business review examples page run 8, 9, and 9 slides, and each shows the prompt that built it. Below: the 10-slide structure with an example action title per slide, the customer, internal, and agency variations, and a prompt that builds the deck from your Q3 report.
What is a quarterly business review?
A quarterly business review is a meeting, and the deck that runs it, where you compare last quarter's results with the goals you set and agree on what happens next. A status update lists what you did. A QBR says whether it worked and asks for a decision.
Three kinds are common. They share a structure and differ in audience:
| QBR type | Who presents | Audience | Main question the deck answers | Example deck |
|---|---|---|---|---|
| Customer QBR | Vendor or customer success manager | The customer's sponsor and users | Did we deliver the value we promised? | Molarbook to Dentavale (9 slides) |
| Internal leadership QBR | Team or region lead | Executives | Did we hit the number, and what changes next quarter? | Shipquill EMEA sales (9 slides) or Fernhollow Coffee Co. (8 slides) |
| Agency client QBR | Agency account lead | The client's marketing owner | Is the budget working, and where should it go next? | Brindlecroft to Kettlewick (8 slides) |
Every company in these decks is invented, so you can reuse the prompts without exposing real data.
The 10-slide QBR structure
Each slide below has one job. The example action titles use the numbers in our Fernhollow Coffee Co. Q3 2026 test file (an invented company: Q3 revenue $1,321,000, 8 KPIs, 3 risks, a Q4 plan). The source PDF is public if you want to rebuild it.
| # | Slide | Its job | Example action title (Fernhollow numbers) |
|---|---|---|---|
| 1 | Cover | Company, quarter, audience | Fernhollow Coffee Co. Q3 2026 review |
| 2 | Executive summary | The quarter in 3 or 4 numbers | Q3 revenue grew 18% to $1,321,000 while margin slipped to 41% |
| 3 | Goals | What you agreed last quarter | The Q2 baseline: $1,120,000 revenue, 8,400 subscribers, 3.8% churn |
| 4 | Results against goals | Each result next to its goal or prior quarter | Revenue, subscribers, and churn all beat Q2 |
| 5 | Drivers | The chart behind the headline | Revenue rose every month, from $412,000 in July to $471,000 in September |
| 6 | What did not go well | The miss and its cause | Gross margin fell 2 points to 41% (43% in Q2) |
| 7 | Risks | What could stop next quarter | Coffee prices up 12%, the roaster at 92% capacity, and 38% of wholesale in two accounts |
| 8 | Next quarter's plan | Actions with dates and owners | A second roaster arrives by 15 November for $180,000 |
| 9 | Target | The number you commit to | Q4 target is $1,500,000, helped by a 4% price rise and 3,000 gift boxes at $48 |
| 10 | Decision and next steps | One clear ask | Approve the $180,000 second roaster this week |
The Fernhollow file sets no formal Q3 goals, so slides 3 and 4 use Q2 as the baseline. With agreed goals, slide 3 lists them and slide 4 scores each one.
To cut to 8 slides, merge goals into results (slides 3 and 4) and plan into target (slides 8 and 9). Our Fernhollow test deck also came out at 8 slides from an 8-slide prompt, with a different cut: title, revenue and margin, monthly revenue chart, channel split, three risks, Q4 plan, Q4 target, and leadership focus. Past 12 slides, move the extra content to an appendix or a pre-read.
Write action titles, not topic labels
Rewrite every slide title as a sentence that states the conclusion. Consulting firms call these action titles. A reader who skims only the titles should get the whole story.
| Topic label | Action title |
|---|---|
| Revenue | New revenue finished $260K below target |
| Online booking | Online booking reached 36%, short of the 40% goal |
| Website traffic | Organic visits beat target at 86,000 against 80,000 |
| Q4 plan | Two clinics go live in Q4, completing all 22 |
Three rules keep an action title checkable:
- Put a number or a comparison in the title. "Revenue grew" is weak. "Revenue grew 18% to $1,321,000" can be checked.
- Two lines at most. A title that needs three lines usually holds two messages, so split the slide.
- The chart must prove the title. If the title says "beat target," the target has to be on the chart.
For more examples, see our guide to McKinsey slides and action titles. The free McKinsey Slide Generator previews an 8-slide consulting outline with action titles and needs no login. Rendered slides and .pptx export run in GenPPT Studio.
Customer QBR template
A customer QBR proves value to the account that pays you. The Molarbook example (invented scheduling software for an invented group of 22 dental clinics) uses 9 slides:
- Cover
- Executive summary
- The goals both sides agreed for Q3
- Results against each goal
- Adoption by clinic
- Support and service (18 tickets, 42-minute median first reply)
- What did not go well
- Plan for Q4
- Decision and next steps (approve a recall campaign add-on)
Spend the most care on the results slide. Molarbook put all three goals on it and marked each as a beat or a miss:
What to copy: list the agreed goals before the results, show the miss without softening it (2 clinics are late because the data export from the old system was slow), and finish with one decision the customer can make in the room.
Internal leadership QBR template
An internal QBR is for executives who sit through many of these. They want the number, the reason, and what changes next. The Shipquill example (an invented shipping software company's EMEA sales region) uses 9 slides:
- Cover
- The quarter on one slide ($2.84M new revenue, 27% win rate, 74-day sales cycle)
- Revenue against target
- Pipeline for Q4 ($9.6M, 3.1 times the target)
- Three wins and why you won
- Three losses and why you lost
- What changes in Q4
- Forecast and risks
- Asks (one solutions engineer and a decision on a price tier)
The prompt behind it carried two rules worth copying: do not use the deck title as a slide headline, and show each chart on one slide only. Both cut the repetition that pads AI decks.
Agency client QBR template
An agency QBR has to justify the retainer and steer next quarter's budget. The Brindlecroft example (an invented SEO agency reporting to an invented online tea shop) uses 8 slides:
- Cover
- Summary
- Results against targets
- What the agency shipped
- What worked and what did not
- What you learned about the customers
- Q4 plan and targets
- Budget and decision (move $1,500 a month from gift pages to video)
What to copy: the customer learning slide. "Buyers search by taste, not by tea type" hands the client a finding about their own buyers on top of the traffic numbers.
How to build a QBR from your Q3 PDF or spreadsheet
Most QBR numbers already sit in a finance PDF, a CRM export, or a spreadsheet, and retyping them into slides adds errors. GenPPT reads the file, puts every figure into an editable slide-by-slide outline, and renders slides only after you approve it.
In our Fernhollow Q3 2026 test, GenPPT with File only mode kept 8 of 8 checked KPIs exact, including the monthly revenue chart (July $412,000, August $438,000, September $471,000). It took 2 min 34 s to reach the outline and concept sheet and 1 min 21 s to render 8 slides.
- Upload your Q3 report (PDF, Word,
.xlsx, or.csv). For spreadsheets, see Excel to PowerPoint with AI on preparing a summary tab. - Choose File only when GenPPT asks whether to research from your file, so no outside numbers get in.
- Paste a prompt that fixes the slide order (template below).
- Check every number in the outline against the source.
- Pick a look from the 4-panel concept sheet, revise single slides in chat with prompts that fix one slide at a time, and export
.pptxor PDF.
Create a 10-slide quarterly business review for the leadership team
from the attached Q3 report.

Slide order: 1 cover, 2 executive summary, 3 Q3 goals, 4 results
against each goal, 5 the main driver as one chart, 6 what did not go
well and why, 7 three risks, 8 Q4 plan with dates, 9 Q4 target,
10 the decision we need.

Rules: use only numbers from the file. Show each result next to its
goal or last quarter. Each headline is a full sentence that states
the conclusion. Do not use the deck title as a slide headline. Show
each chart on one slide only.
Without an account, the free PDF to PowerPoint converter turns a text PDF (up to 8 MB and 30 pages) into an outline and 3 designed slides as a .pptx, 3 times a day. Full decks need GenPPT Studio, which starts at a $1 three-day trial (card required), then $25/mo or $99/yr for 20 decks a month through the AI PowerPoint generator.
QBR mistakes to avoid
- Activity instead of outcomes. "We shipped 14 guides" belongs under a result ("Organic revenue rose 24%"), not in place of one.
- Numbers without targets.
86,000 visitsmeans nothing until the slide says the target was80,000. - Hiding the miss. Executives and customers usually know already. A dedicated slide with the cause earns more trust than a footnote.
- Rounded numbers that drift. If slide 2 says
$1.3Mand slide 5 says$1,321,000, someone will ask which is right. Pick one format. - A deck title on every slide. Each headline should carry that slide's conclusion.
- No ask. End with a decision, an approval, or a budget move, with a date.
When GenPPT is the wrong tool for your QBR
GenPPT renders each slide as a full-bleed designed image inside the .pptx or PDF, so the look holds on every screen. Other tools fit better in four cases:
| Your situation | Better pick | Why |
|---|---|---|
| The QBR must use your company's locked Slide Master with editable text boxes | Plus AI or Microsoft Copilot | They build native text boxes inside PowerPoint or Google Slides |
| Several people edit the deck at the same time | Canva or Google Slides | Live multi-cursor editing; GenPPT review is asynchronous |
| Finance refreshes charts from Excel every month | A linked native PowerPoint chart | GenPPT charts are rendered, not linked to a workbook |
| You send a scrollable pre-read, not a presented deck | Gamma | Free to start, built for web-card links |
If you need editable text after export, read full-bleed slides vs editable text boxes for the full trade-off and a hybrid workaround.
QBR presentation FAQs
How many slides should a QBR presentation have?
8 to 10 slides for most QBRs. The median deck made in GenPPT has 10 slides, and 46% have 6 to 10 (1,034 generated decks, 3 August to 11 October 2026). Put detail tables in an appendix or a pre-read.
What should be in a QBR deck?
An executive summary, the goals you agreed, results against each goal, what drove the results, what did not go well, risks, next quarter's plan and target, and one decision you need.
What is the difference between a customer QBR and an internal QBR?
A customer QBR proves value to the account that pays you and often ends with an upsell or renewal decision. An internal QBR reports performance to executives and ends with a resource ask. The 10-slide structure fits both, with a different emphasis for each audience.
How long should a QBR meeting be?
Plan for the deck to take about half the meeting and the discussion and decision the other half. A 10-slide deck with action titles lets the room skip ahead to the slides that need debate.
Can AI make a QBR presentation from my data?
Yes. Upload the report or spreadsheet to GenPPT, choose File only, and check every number in the outline before slides render. In our Fernhollow Q3 2026 test, 8 of 8 checked KPIs matched the source. You can also start from the free PDF to PowerPoint converter.