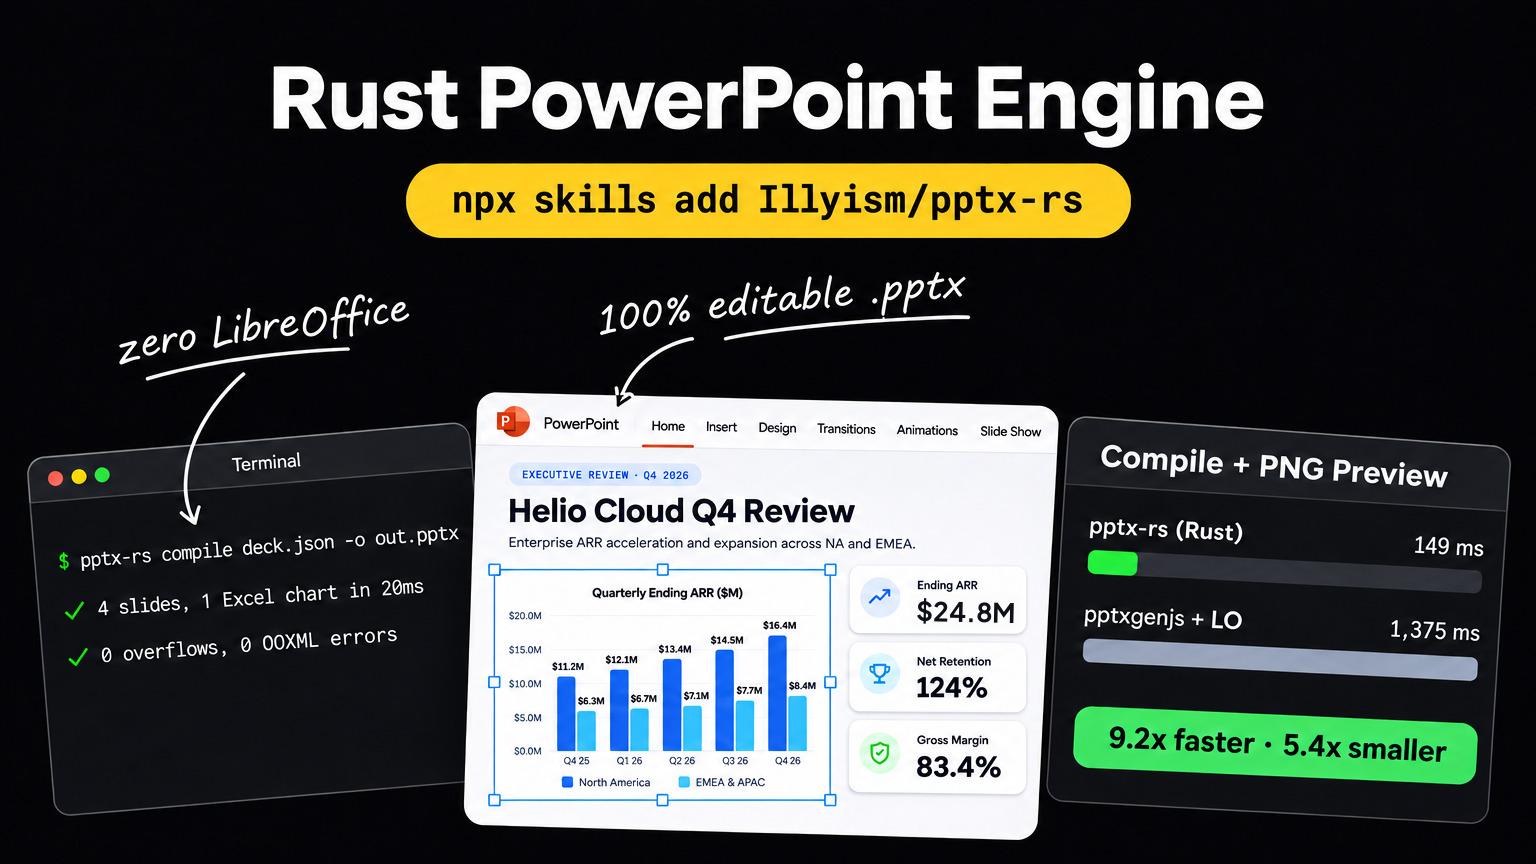
GenPPT draws every slide as an image. The decks look art-directed because of it, and the exported .pptx holds one full-slide picture per slide. You can present that file. You can't click a number and change it.
We wanted editable exports, so I wrote a PowerPoint engine in Rust: a compiler, a .pptx importer, a validator, and a PNG preview renderer in one 12 MB binary. It passed every engineering check we had. Then we put its one-shot LLM layouts next to real customer decks from GenPPT's visual pipeline, and the visual decks looked better. GenPPT stays visual-first. The engine is open source as pptx-rs under the MIT license.
This post covers what the engine does, how it benchmarks against pptxgenjs, and how to turn a GenPPT image export into an editable deck with it, including a timed run on a real GenPPT slide.
Why we built pptx-rs
A coding agent that writes slides needs three things from its tooling: text that fits its box, a preview it can look at, and a file PowerPoint opens without a repair prompt. The existing options miss at least one.
pptxgenjs and python-pptx write XML without measuring text. They can't tell you a headline overflows, can't read an existing deck back into a clean schema, and can't show you a slide without LibreOffice.
LibreOffice pipelines can render, but a preview took 1.3 to 2.8 seconds in our benchmark, the container is heavy, and fonts get substituted when a customer opens the file in PowerPoint.
pptx-rs is one binary with six commands: compile, render, validate, import, mutate, and schema.
- Text fitting with HarfBuzz (
rustybuzz). The compiler shapes every text box twice, once in the chosen font and once inArimo(metric-identical to Arial), so copy stays inside its box when PowerPoint substitutes fonts on another machine. - 10 Excel-backed chart types. Bar, horizontal bar, stacked bar, combo bar-line, waterfall, scatter, line, area, pie, and doughnut. Each chart embeds a real
.xlsxworkbook (rust_xlsxwriter), andcalaminechecks that the workbook matches the chart's XML cache. - PNG previews through
resvg. About 30 ms per vector slide at 1280px, with no LibreOffice. - A
.pptximporter. It reads text, multi-level lists, shapes, gradients, tables, charts, images, SmartArt fallbacks, and speaker notes into the same JSON the compiler takes. - Limits for multi-tenant servers. ZIP caps (100 MiB archive, 2,000 entries, 128 MiB inflated), XML depth and node limits, image pixel caps, and
PPTX_RS_DISABLE_LOCAL_PATHS=1to block filesystem reads.

pptx-rs vs pptxgenjs
| Capability | pptx-rs (Rust) | pptxgenjs (Node.js) |
|---|---|---|
| Runtime | One binary (~12 MB) | Node.js or browser + node_modules |
| PNG / SVG preview | Built in (resvg, ~30 ms per vector slide) | Needs LibreOffice + pdftoppm |
| Text overflow detection and auto-fit | Yes (HarfBuzz via rustybuzz, checked against Arimo) | No (writes XML without measuring text) |
.pptx to JSON importer | Yes (text, tables, charts, media, SmartArt) | No (write-only) |
| OOXML and Excel parity validator | Yes ([Content_Types].xml, rels, .xlsx caches) | No (4.0.1 emits N - 1 dangling slideMaster <Override> entries) |
| Excel-backed charts | 10 types (rust_xlsxwriter + calamine parity check) | Yes (pptx.addChart) |
| Fonts and script routing | 9 bundled TTFs, plus RTL, Turkish, Greek, and Cyrillic routing | Relies on host or PowerPoint fonts |
| Security caps (ZIP bomb, XML depth, sandbox) | Built in (PPTX_RS_DISABLE_LOCAL_PATHS=1) | None built in |
| Authoring model | Declarative JSON (pptx-rs schema) + Agent Skill | Imperative JS API |
Real benchmarks
We ran pptx-rs against pptxgenjs 4.0.1 on an Apple M5 Max (darwin-arm64, Node.js v24.22.2, headless LibreOffice + pdftoppm). Both tools built identical 4-, 10-, and 25-slide decks: a cover, a 4-card KPI dashboard, a 2-series bar chart, and a styled 7x5 table. Each number is the median of 9 compile runs and 3 render runs from bench/compare-pptxgenjs.mjs.
Compile + 1280px PNG preview (what an AI coding agent waits on)
| Deck Size | pptx-rs Compile + Render | pptxgenjs + LibreOffice PNGs | Speedup |
|---|---|---|---|
| 4 slides | 148.8 ms (20.0 ms compile + 128.8 ms render) | 1,374.5 ms (47.4 ms + 1,327.1 ms) | 9.2x faster |
| 10 slides | 355.0 ms (42.3 ms compile + 312.7 ms render) | 1,868.2 ms (54.5 ms + 1,813.7 ms) | 5.3x faster |
| 25 slides | 849.5 ms (109.7 ms compile + 739.8 ms render) | 2,888.9 ms (64.4 ms + 2,824.5 ms) | 3.4x faster |
Compile time, file size, and OOXML validation
| Metric | 4 Slides | 10 Slides | 25 Slides |
|---|---|---|---|
pptx-rs cold CLI (compile + HarfBuzz fit + validate) | 20.0 ms (17 ms internal) | 42.3 ms (38 ms internal) | 109.7 ms (104 ms internal) |
pptxgenjs cold CLI (Node startup + write, no shaping or validation) | 47.4 ms | 54.5 ms | 64.4 ms |
pptxgenjs warm in-process (XML emit only) | 4.2 ms | 6.6 ms | 13.8 ms |
.pptx file size (pptx-rs vs pptxgenjs) | 28.7 KB vs 154.3 KB (5.4x smaller) | 57.8 KB vs 296.9 KB (5.1x smaller) | 139.6 KB vs 737.7 KB (5.3x smaller) |
pptx-rs validate errors (pptx-rs vs pptxgenjs) | 0 vs 3 dangling slideMaster overrides | 0 vs 9 dangling slideMaster overrides | 0 vs 24 dangling slideMaster overrides |
pptxgenjs wins one row. In a warm Node process it emits XML in 4 to 14 ms, because it skips font shaping, validation, and previews. pptx-rs spends 17 to 104 ms shaping every text run twice, writing .xlsx workbooks, and validating each XML part and chart cache. The preview step is where the time goes for an agent: LibreOffice needs 1.3 to 2.8 seconds, and pptx-rs needs 129 to 740 ms.
Why we kept visual-first slides in GenPPT
We fed real customer prompts to a single-shot LLM that authored raw { x, y, w, h } coordinates. The output was valid, editable, and typo-free. It was also plainer than what GenPPT already made: no custom illustrations, no brand marks, and template cards that all looked alike.
That drew the line for us:
- Hosted decks stay in GenPPT. People pay for GenPPT because the slides look designed. Browse real output on the GenPPT showcase, or see how it scores against Gamma, Plus AI, Canva, and Copilot in our 2026 AI presentation maker benchmark.
- Agent-built and programmatic decks go to pptx-rs. Claude Code, Cursor, or Codex with a terminal can compile, render, look at every PNG, and fix spacing in a loop that takes about 150 ms per pass. The look-and-fix passes are what close the gap that a one-shot layout leaves.
The two also combine, which is the rest of this post.
How to convert GenPPT slide images into an editable .pptx
A GenPPT deck exports three ways from the Export menu: PDF (.pdf), PowerPoint (.pptx), and Images (.zip). Exporting needs an active plan or the $1 three-day trial.
The PowerPoint export is one full-slide image per slide. That's the right file when you only need to present. When someone has to edit a number in PowerPoint or open a chart in Excel, start from the image export and rebuild the slides that need it.
What the Images (.zip) export gives you
The ZIP holds the stored slide images at full resolution, with no re-encoding, named by slide number:
genppt-slides/
  slide-01.png
  slide-02.png
  slide-03.png
  ...
The extension follows the stored format, so a deck can also contain .jpg or .webp files. pptx-rs embeds PNG and JPEG as they are and converts WebP to PNG.
Unzip the export next to where your deck JSON will live:
unzip your-deck-images.zip -d genppt-slidesThen build pptx-rs (Rust 1.89 or newer) and put it on your PATH:
git clone https://github.com/Illyism/pptx-rs.git
cd pptx-rs
cargo build --release
export PATH="$PWD/target/release:$PATH"
Workflow A: keep the artwork, make the content editable
A GenPPT slide has two layers baked into one picture: artwork you want to keep and content someone will want to change. In deck.ir.json you split them again.
plateplaces an image full-bleed or framed. With"scrim": "auto", the compiler reads the pixels behind each text box and adds a gradient only where contrast falls below WCAG AA (4.5:1).cutoutplaces a cropped or masked piece of an image (circle,roundRect,arch,diamond), with an optional border and shadow.srcRectcrops either one. It takes[left, top, right, bottom]as fractions to trim from each edge, so you can cut the artwork out of a slide and leave its baked-in text behind.text,table, andchartgo on top as native PowerPoint objects.
For the test I took the 11-slide Product-Led Growth deck from the GenPPT homepage. Slide 1 has a 3D funnel on the right and the title on the left. Slide 6 is a metrics framework with five targets. The JSON below rebuilds both: the funnel becomes a plate under an editable title, and the five targets become a native table and an Excel-backed chart, with the funnel repeated as a small circular cutout.
{
  "irVersion": 1,
  "title": "Product-Led Growth Strategy",
  "theme": {
    "aspectRatio": "16:9",
    "bg": "#F4F5FA",
    "surface": "#FFFFFF",
    "fg": "#0B1437",
    "muted": "#5B6478",
    "accent": "#4F46E5",
    "accentSecondary": "#22B8CF",
    "fontDisplay": "Plus Jakarta Sans",
    "fontBody": "Inter"
  },
  "slides": [
    {
      "background": "#0B1437",
      "elements": [
        {
          "name": "Funnel art from slide-01",
          "type": "plate",
          "rect": { "x": 0, "y": 0, "w": 100, "h": 100 },
          "zIndex": 0,
          "source": { "path": "genppt-slides/slide-01.png" },
          "srcRect": [0.46, 0.14, 0, 0.32],
          "scrim": "auto",
          "scrimColor": "#0B1437"
        },
        {
          "name": "Cover headline",
          "type": "text",
          "rect": { "x": 6, "y": 52, "w": 52, "h": 26 },
          "zIndex": 2,
          "text": "Product-Led\nGrowth Strategy",
          "role": "display",
          "sizePt": 48,
          "minSizePt": 36,
          "bold": true,
          "color": "#FFFFFF",
          "lineHeight": 1.08
        },
        {
          "name": "Cover subtitle",
          "type": "text",
          "rect": { "x": 6, "y": 78, "w": 50, "h": 13 },
          "zIndex": 2,
          "text": "Build a scalable PLG engine that acquires, activates, and expands customers through the product.",
          "sizePt": 16,
          "color": "#E2E8F0",
          "lineHeight": 1.35
        }
      ]
    },
    {
      "background": "#F4F5FA",
      "elements": [
        {
          "name": "Slide title",
          "type": "text",
          "rect": { "x": 5, "y": 6, "w": 70, "h": 10 },
          "zIndex": 2,
          "text": "PLG Metrics Framework",
          "role": "display",
          "sizePt": 32,
          "bold": true
        },
        {
          "name": "Slide subtitle",
          "type": "text",
          "rect": { "x": 5, "y": 16, "w": 70, "h": 6 },
          "zIndex": 2,
          "text": "Define the core KPI suite and target benchmarks across the user lifecycle.",
          "sizePt": 15,
          "color": "#5B6478"
        },
        {
          "name": "Funnel cutout from slide-01",
          "type": "cutout",
          "rect": { "x": 84, "y": 5, "w": 10.5, "h": 18.7 },
          "zIndex": 2,
          "source": { "path": "genppt-slides/slide-01.png" },
          "srcRect": [0.545, 0.16, 0.103, 0.21],
          "clipShape": "circle",
          "borderColor": "#FFFFFF",
          "borderWidthPt": 2,
          "shadow": { "blurPt": 14, "distPt": 4, "color": "#0B143722" }
        },
        {
          "name": "Metrics table",
          "type": "table",
          "rect": { "x": 5, "y": 27, "w": 52, "h": 56 },
          "zIndex": 2,
          "headers": ["Metric", "Target", "Definition"],
          "rows": [
            ["Activation Rate", "≥ 40%", "Users who experience the core value"],
            ["Time-to-Value", "≤ 5 min", "Median time to first win"],
            ["Retention Baseline", "≥ 25%", "Week 4 retention (minimum)"],
            ["Expansion Index", "≥ 1.3x", "Net revenue expansion from existing users"],
            ["Trial-to-Paid Conversion", "≥ 15%", "Trials converting to paid accounts"]
          ],
          "columnWeights": [1.9, 0.8, 2.2],
          "columnAligns": ["left", "right", "left"],
          "fontSizePt": 13,
          "headerBg": "#0B1437",
          "headerFg": "#FFFFFF",
          "rowBg": "#FFFFFF",
          "altRowBg": "#EEF0F8",
          "borderColor": "#D5D9E6"
        },
        {
          "name": "Targets chart",
          "type": "chart",
          "chartType": "horizontalBar",
          "rect": { "x": 60, "y": 27, "w": 35, "h": 56 },
          "zIndex": 2,
          "title": "Percentage targets",
          "categories": ["Activation Rate", "Retention Baseline", "Trial-to-Paid"],
          "series": [{ "name": "Target", "values": [0.4, 0.25, 0.15], "color": "#4F46E5" }],
          "numberFormat": "0%",
          "showDataLabels": true
        },
        {
          "name": "Footnote",
          "type": "text",
          "rect": { "x": 5, "y": 86, "w": 90, "h": 5 },
          "zIndex": 2,
          "text": "Benchmarks vary by stage and segment. Review monthly.",
          "sizePt": 10,
          "color": "#5B6478"
        }
      ]
    }
  ]
}
Three details in that file matter when you write your own:
- Coordinates are percentages of the slide, and image paths resolve from the directory you run
pptx-rsin. - A full-bleed
srcRectcrop must keep the slide's aspect ratio. The plate trims 46% from the left and 46% from top and bottom combined, so the remaining 54% by 54% is still 16:9 and nothing stretches. The cutout keeps a square of pixels for its circular mask. - Every number in the table and chart comes from the source slide. Nothing in a rebuilt deck should be retyped from memory.
Compile, render, and validate:
pptx-rs compile -i deck.ir.json -o deck.pptx --report compile-report.json
pptx-rs render -i deck.ir.json --out-dir previews --width 1280 --report render-report.json
pptx-rs validate deck.pptx
The timed test run
Same machine as the benchmarks above (Apple M5 Max), pptx-rs 0.1.0. The homepage copies of the slides are 1376x768 JPGs, so I converted them to PNG first to match the ZIP naming.
$ pptx-rs compile -i deck.ir.json -o deck.pptx --report compile-report.json
Compiled 2 slides (1 charts, 1 media, 1 scrims) in 20ms -> deck.pptx

$ pptx-rs render -i deck.ir.json --out-dir previews --width 1280 --report render-report.json
Rendered 2 slide(s) in 160ms -> previews

$ pptx-rs validate deck.pptx
Validated 'deck.pptx': 22 parts, 20 XML parts, 19 rels, 2 slides, 1 Excel-backed charts
PASS: 0 errors.
The top of compile-report.json:
{
  "slideCount": 2,
  "chartCount": 1,
  "mediaCount": 1,
  "scrimsInserted": 1,
  "compileMs": 20
}| Measurement | Result |
|---|---|
compileMs over 9 runs | 20 to 21 ms |
compile wall clock, median of 15 runs | 24.7 ms |
renderMs for two 1280px PNGs, 5 runs | 155 to 158 ms |
render wall clock, median of 15 runs | 162.5 ms |
validate wall clock, median of 15 runs | 2.5 ms |
deck.pptx size | 607,971 bytes |
Embedded slide-01.png | 590,657 bytes |
Text boxes with overflowWarning | 0 of 5 |
scrimsInserted | 1 |
| Validator errors | 0 |
What those numbers say:
- One scrim, on the cover. White text over a pale plate fails 4.5:1, so the compiler added a left-to-right gradient in the scrim color that starts at 72% opacity and fades to 0. Slide 2 has no plate under its text and got none.
- One media part for two uses. The plate and the cutout reference the same PNG. The archive stores it once.
- The file is 97% image. The slide XML, chart, and embedded Excel workbook add about 17 KB on top of the PNG. Compiling the same JSON against the original 96 KB JPEG of that slide produced a 113,548-byte deck.
- Image slides render slower than vector slides. Two slides took about 157 ms here, against about 30 ms per slide for the vector deck in the benchmarks. The cover decodes and scales a full-resolution PNG.
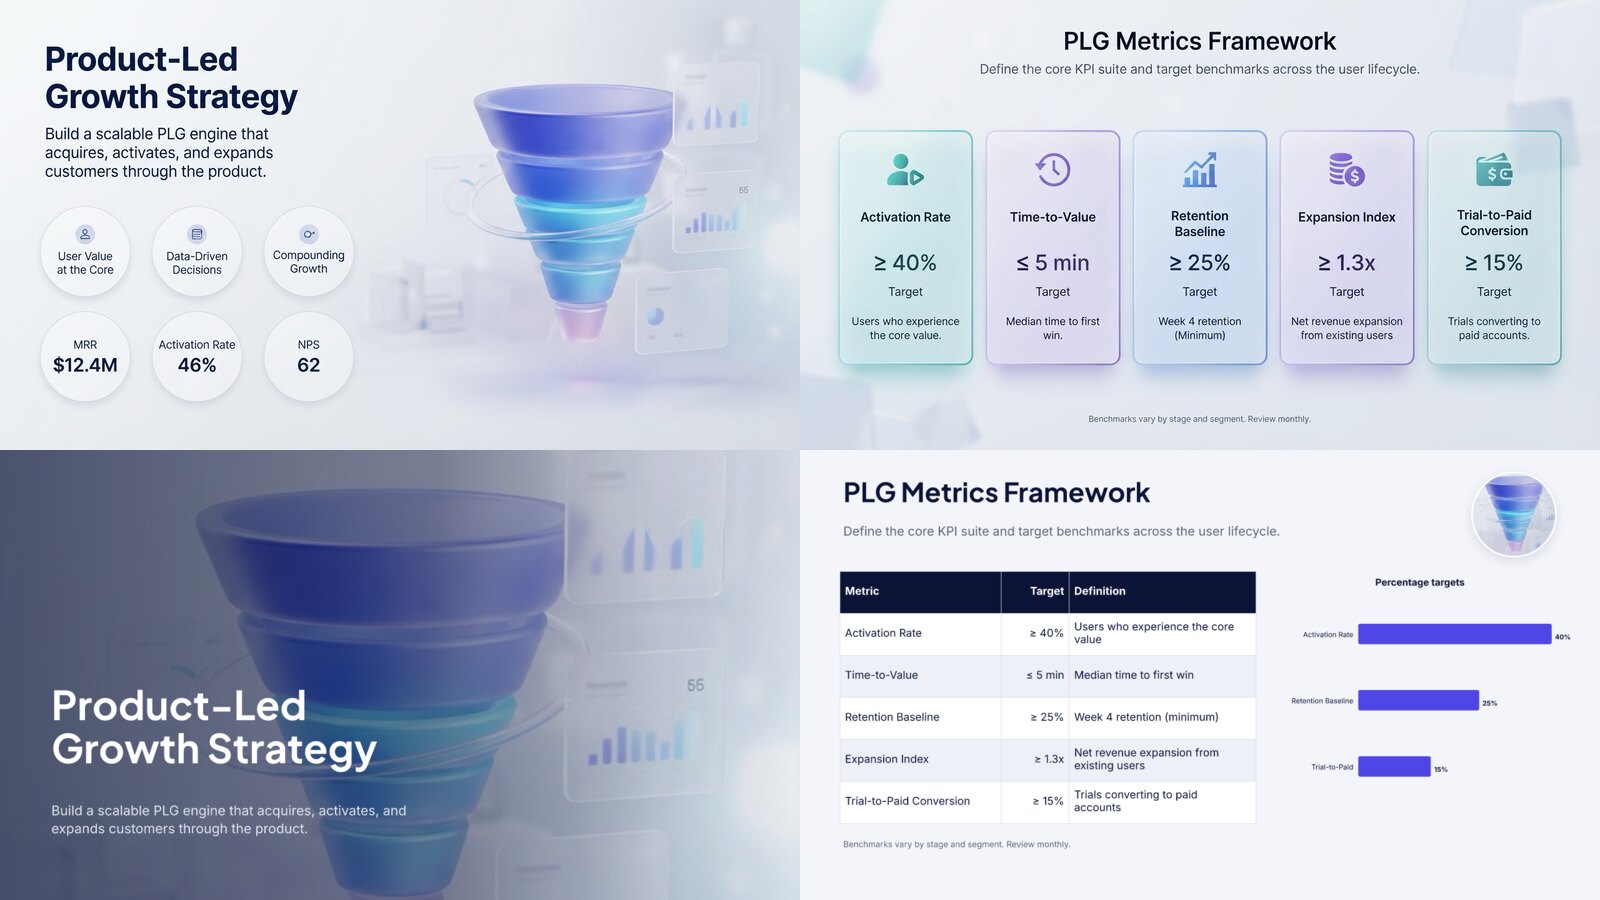
The top row is the GenPPT source. The bottom row is pptx-rs render output from the JSON above.
The first render caught a real bug in my JSON. I had written the chart values as [40, 25, 15] with the number format 0"%", and the preview labelled the first bar 4000%. Switching to fractions ([0.4, 0.25, 0.15]) with the Excel format 0% fixed it. The compile had passed both times. Only the PNG showed the problem, which is why the render step is in the loop.
Look at the bottom-right slide again. It is editable, correct, and plainer than the GenPPT original above it. That trade is the reason GenPPT stays visual-first, and the reason to convert only the slides someone needs to edit.
Workflow B: have a coding agent rebuild the whole deck
Doing this by hand for 2 slides is fine. For 20, give the job to an agent that can read images and run a terminal. Install the skill in your project:
npx skills add Illyism/pptx-rsThen paste this prompt into Claude Code, Cursor, or Codex, in the folder that contains genppt-slides/:
Rebuild the deck in ./genppt-slides/ as an editable PowerPoint file using the pptx-rs skill.

1. Open every image in ./genppt-slides/ (slide-01, slide-02, ...) and list what each slide
   contains: headline, body copy, numbers, tables, charts, and artwork.
2. Write deck.ir.json (SlideDeckIr v1, run `pptx-rs schema` for field names) with one slide
   per image, in the same order.
   - Transcribe copy and numbers exactly as they appear. Do not round, reword, or fill gaps.
     If a number is unreadable, stop and ask me.
   - Rebuild text as `text` or `list`, tables as `table`, and any chart with 3 or more data
     points as a native `chart` with the exact values.
   - Keep illustrations, photos, and 3D artwork by referencing the source image as a `plate`
     or `cutout` with a `srcRect` crop that excludes baked-in text. Use "scrim": "auto" on
     any plate that sits under text.
   - Use only the fonts bundled with pptx-rs.
3. Run:
   pptx-rs compile -i deck.ir.json -o deck.pptx --report compile-report.json
   pptx-rs render -i deck.ir.json --out-dir previews --width 1280
4. Fix every text box in compile-report.json with overflowWarning true or missingGlyphs
   above 0.
5. Open each previews/slide-N.png next to the matching ./genppt-slides/ image. Compare
   layout, spacing, hierarchy, and every number. Fix deck.ir.json and repeat steps 3 to 5
   until each slide matches its source and no text is clipped.
6. Run `pptx-rs validate deck.pptx` and report: slides rebuilt, charts created, plates and
   cutouts used, and anything you could not reproduce.
Three rules in that prompt do most of the work. Transcribe, don't paraphrase: the deck's numbers were approved once and should survive the rebuild unchanged. Crop artwork instead of redrawing it, because the art direction is what you paid GenPPT for. And compare previews against the source images on every pass, since a compile that succeeds tells you nothing about how the slide looks.
A full pass of compile and render stayed under 200 ms in my test, so the agent's time goes to reading images and editing JSON. The tooling adds almost nothing.
When to convert and when to skip it
Convert when someone downstream has to change the content:
- Executive decks and board updates, where finance corrects a figure the night before.
- Client QBRs, where the account team swaps in next quarter's numbers and the client wants the chart data in Excel.
- Investor decks, where metrics move every week of the raise.
- Templates that a team will reuse with new copy.
Skip it when the picture is the product:
- Social carousels for LinkedIn, X, Instagram, or TikTok. They ship as images anyway, so the ZIP is already the final format.
- Decks built on custom illustration, where the artwork fills the slide and there's little text to edit. A rebuilt version loses what made it good.
- Present-once decks. GenPPT's own
.pptxor PDF export opens in PowerPoint, Google Slides, and Keynote and looks exactly like the slides you approved.
Most real decks split. Keep the cover, section dividers, and illustration-heavy slides as plates, and rebuild the data slides as native objects.
Pairing pptx-rs with GenPPT MCP
You can skip the ZIP and let the agent talk to GenPPT directly. The repo ships two Agent Skills, and one command installs both:
npx skills add Illyism/pptx-rspptx-rs(SKILL.md) teaches Claude Code, Cursor, or Codex the local loop: write JSON,compile,render, inspect, fix.pptx-rs-genppt(skills/pptx-rs-genppt/SKILL.md) pairs that loop with the remote GenPPT MCP server (https://genppt.com/mcp) in two directions:- Art in, editable deck out. The agent asks GenPPT for 1 to 3 text-free background plates or cover illustrations, then layers editable text, tables, and Excel charts over them in
pptx-rs, with automatic contrast scrims. - Old deck in, redesign out.
pptx-rs importextracts the copy, numbers, tables, and images from an existing PowerPoint file into JSON, and the agent sends those exact metrics togenppt_create_slideshowfor a visual upgrade.
- Art in, editable deck out. The agent asks GenPPT for 1 to 3 text-free background plates or cover illustrations, then layers editable text, tables, and Excel charts over them in
Clone the engine at github.com/Illyism/pptx-rs. Build art-directed decks and social slideshows in GenPPT ($1 three-day trial, then $25/mo or $99/yr) or through genppt.com/mcp.