
Original 2004 deck · 26 slides. Click a thumbnail or scroll down for the full breakdown.
Eduardo Saverin built this Spring 2004 media kit to sell online advertising on thefacebook.com, not a classic VC deck, but the document Peter Thiel saw before investing $500K that summer. Two months after launch, the kit already shows 70,000 student users, 3 million daily pageviews, and expansion across every Ivy League school plus Stanford, MIT, and Berkeley. Note the campus-by-campus rollout proof, engagement metrics that precede revenue, and press quotes that bookend the story.

Original 2004 deck · 26 slides. Click a thumbnail or scroll down for the full breakdown.
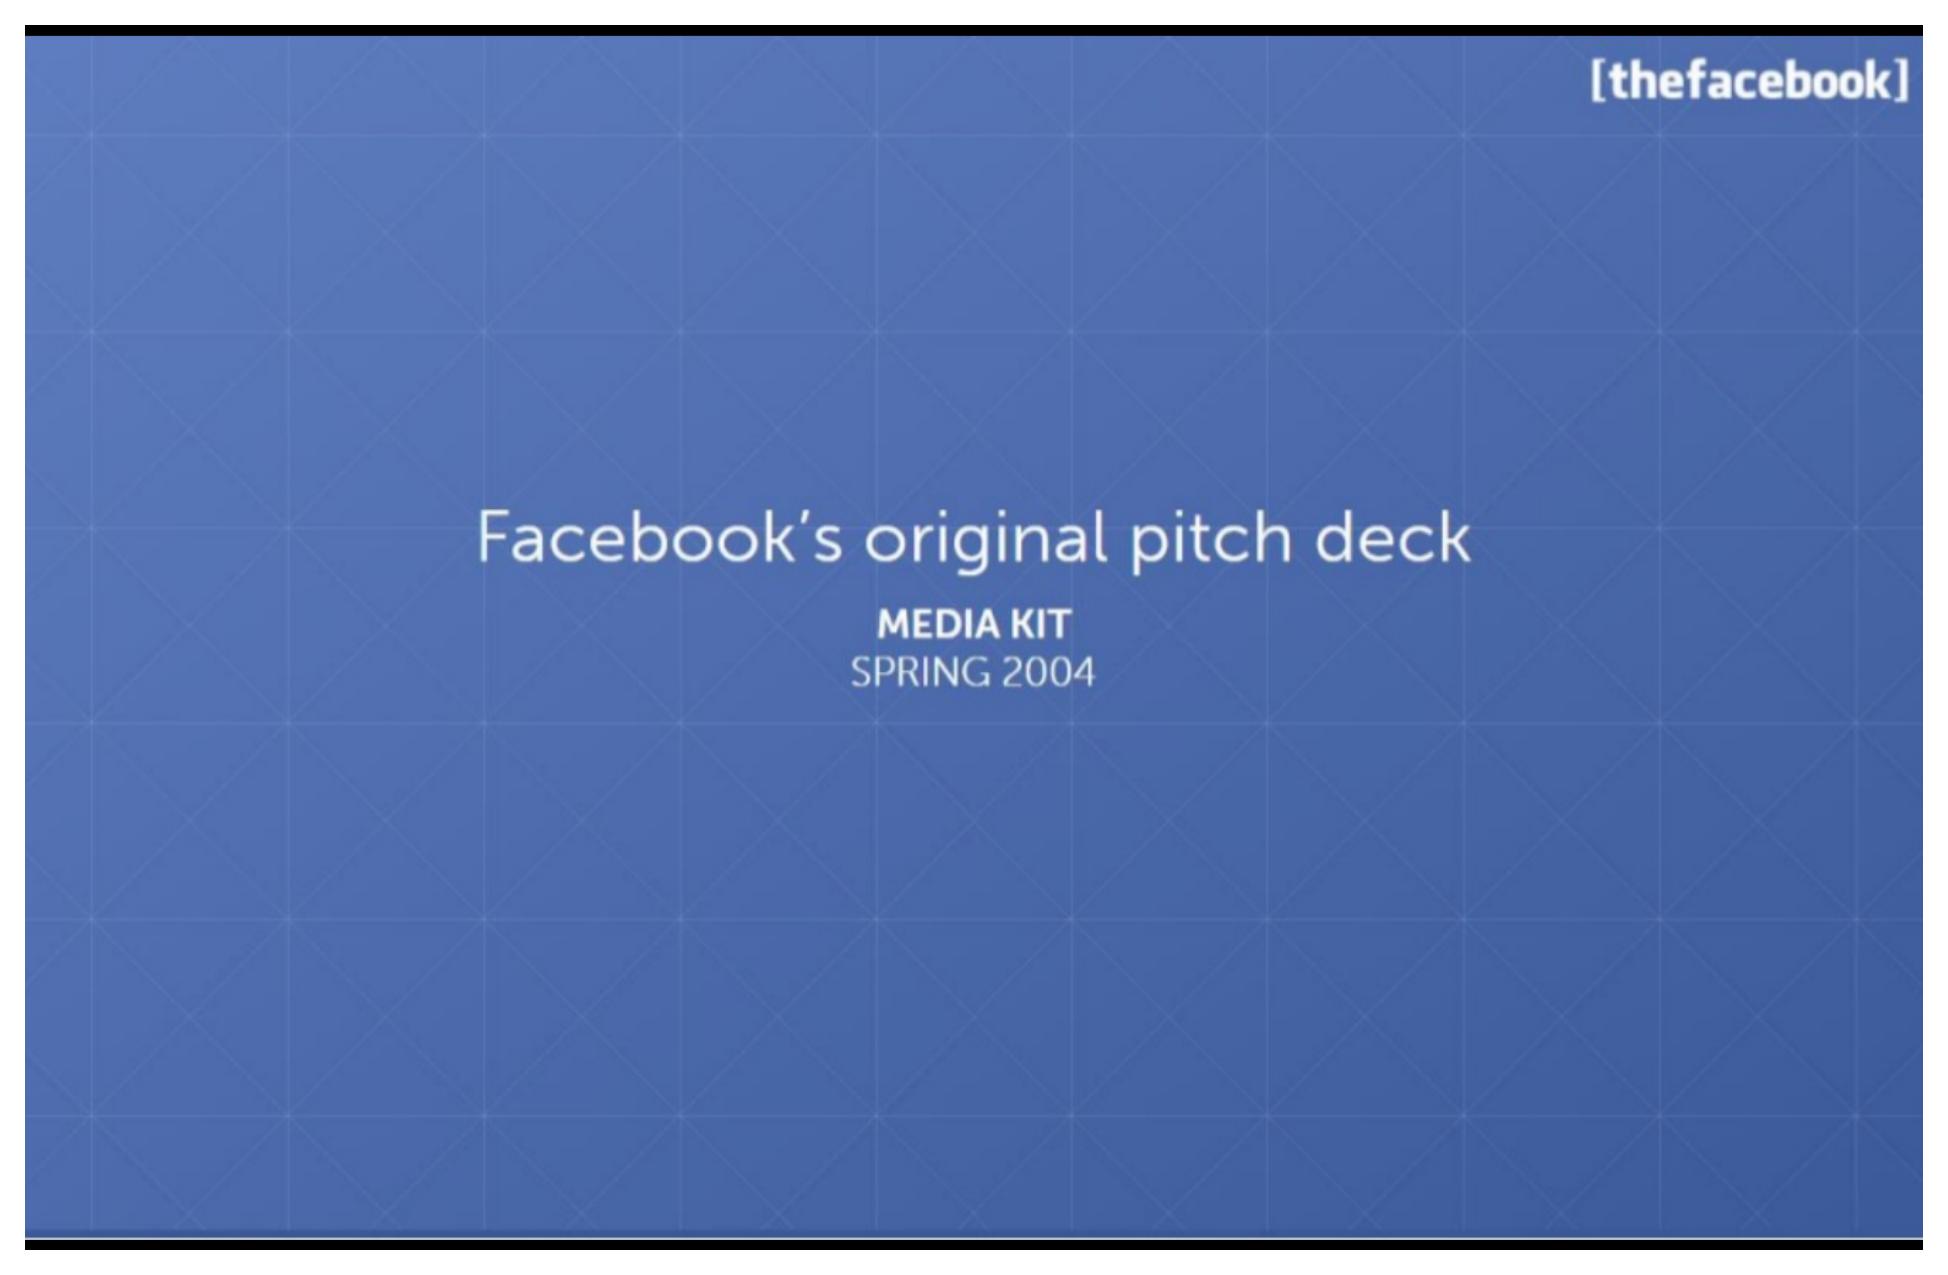
Cover reads "Facebook's original pitch deck" with a MEDIA KIT subtitle and Spring 2004 date on branded blue grid.

Frames the document as a sales kit for advertisers, not a fundraising memo, a format Saverin could hand to brands while the product was still pre-revenue.
Table of contents listing cover, opening quote, solution, product, validation, vision, demographics, engagement, growth, services, contact, and closing quote.
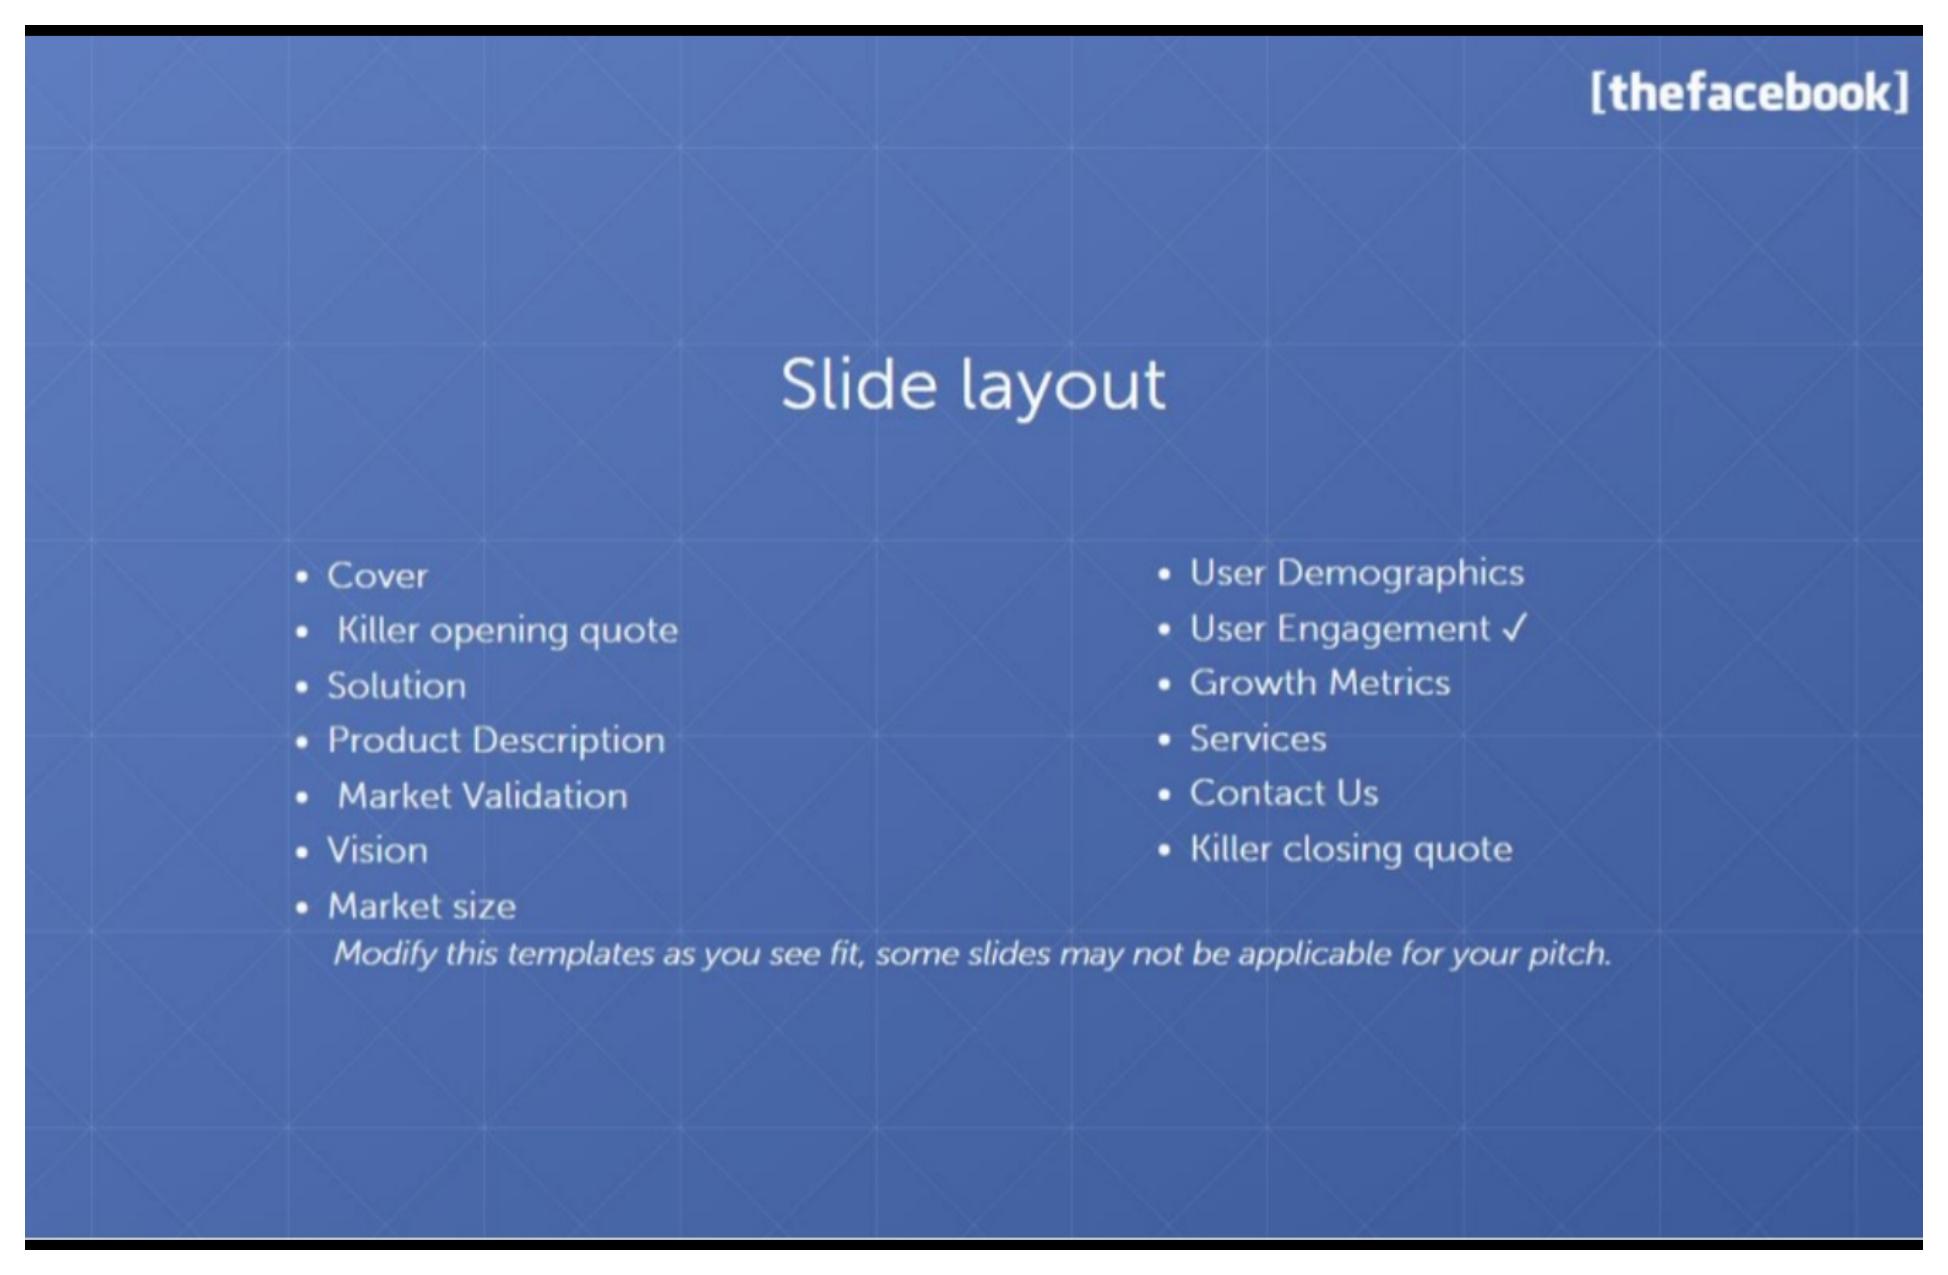
Unusual in investor decks but smart for a media kit, advertisers get a roadmap before the pitch. Shows the narrative arc was planned, not improvised.
The Stanford Daily (03/05/2004): classes skipped, work ignored, students glued to thefacebook.com. "the craze has swept through campus."
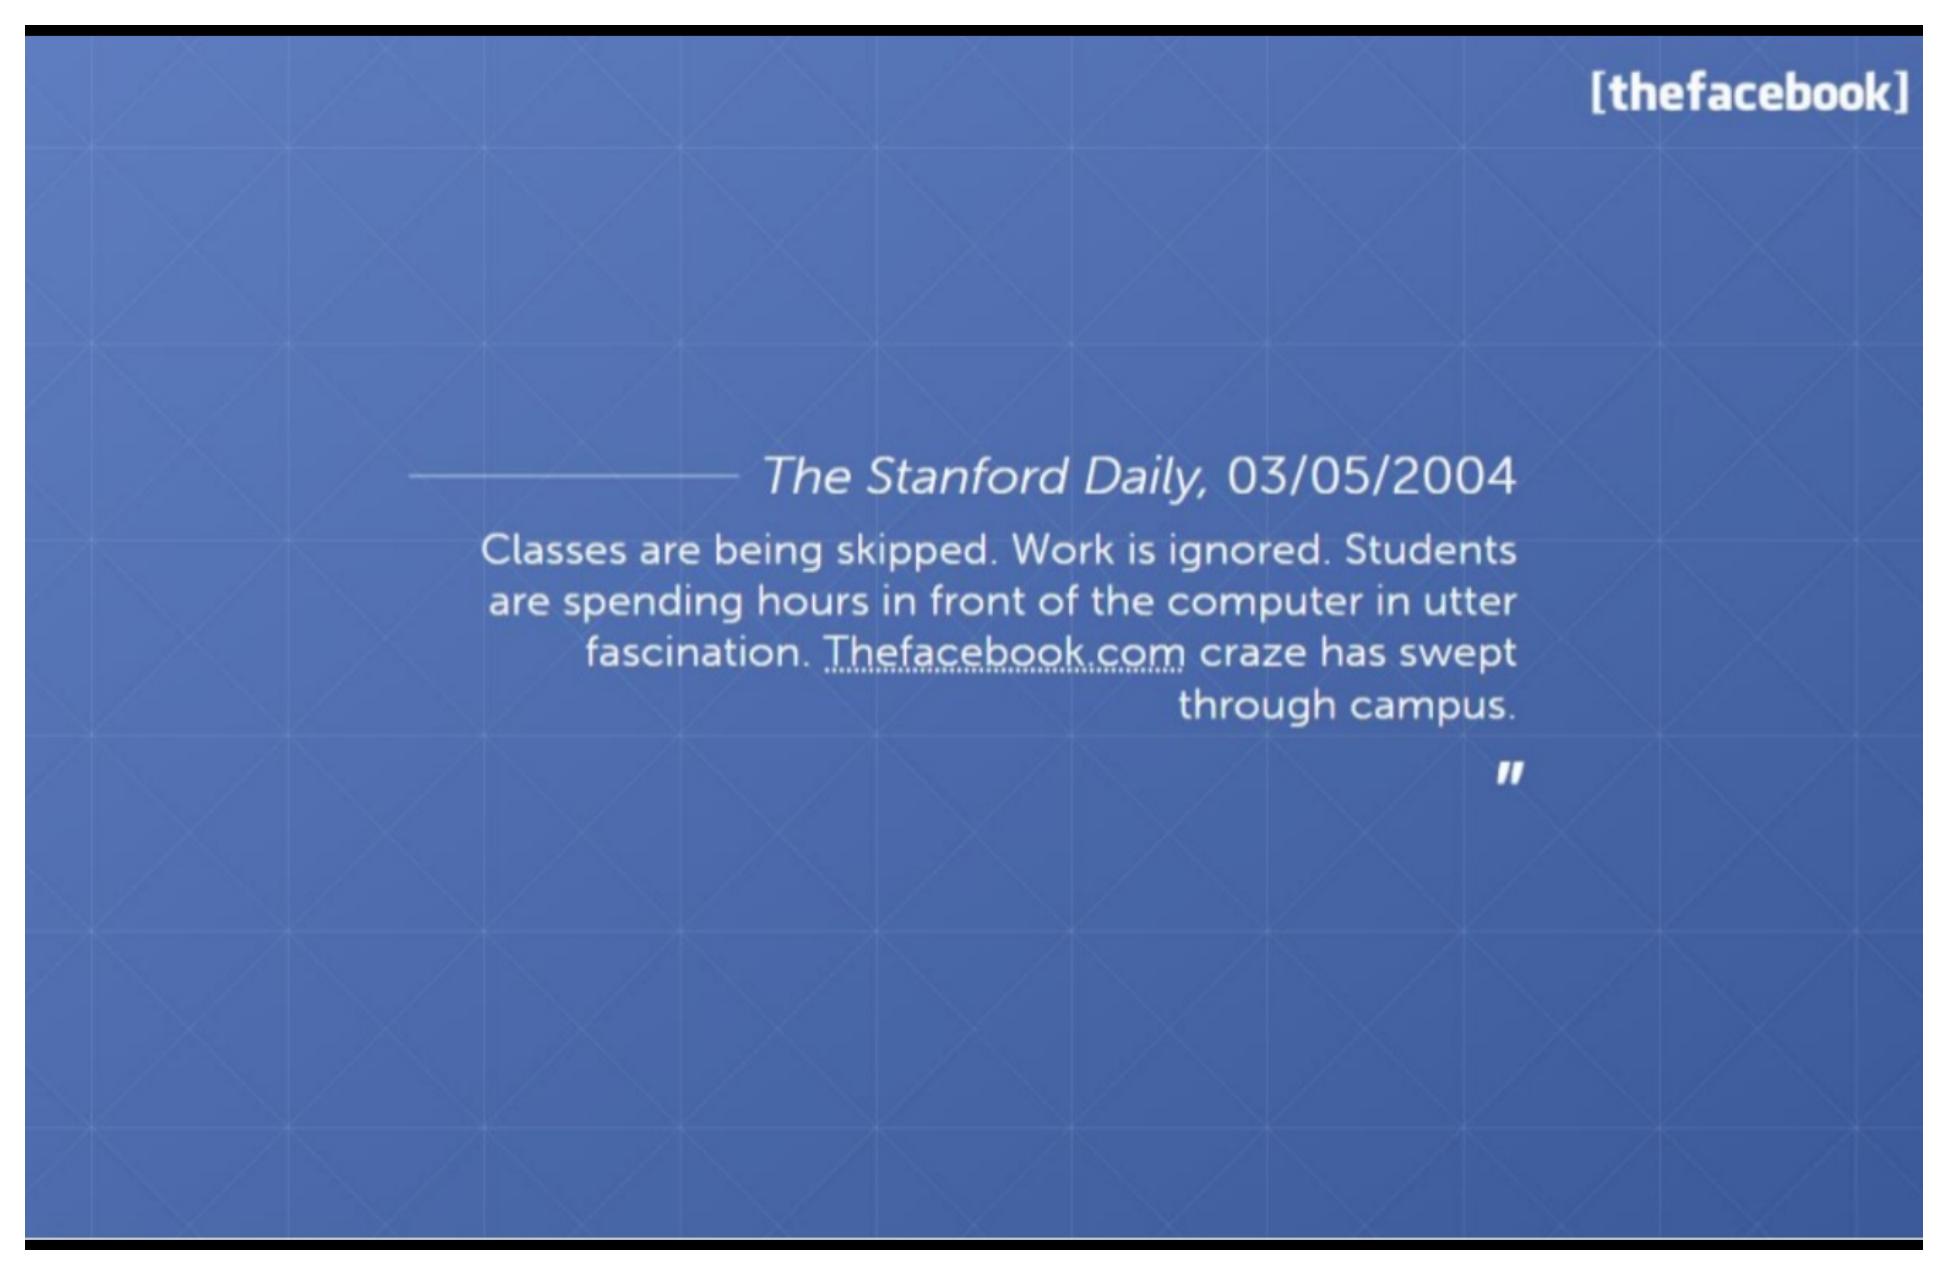
Opens with earned media, not a mission statement. The quote proves product-market fit at an elite school before any user chart appears.
An expanding online directory connecting students, alumni, faculty, and staff through school social networks, with friendship, course, and inter-school links plus built-in messaging.
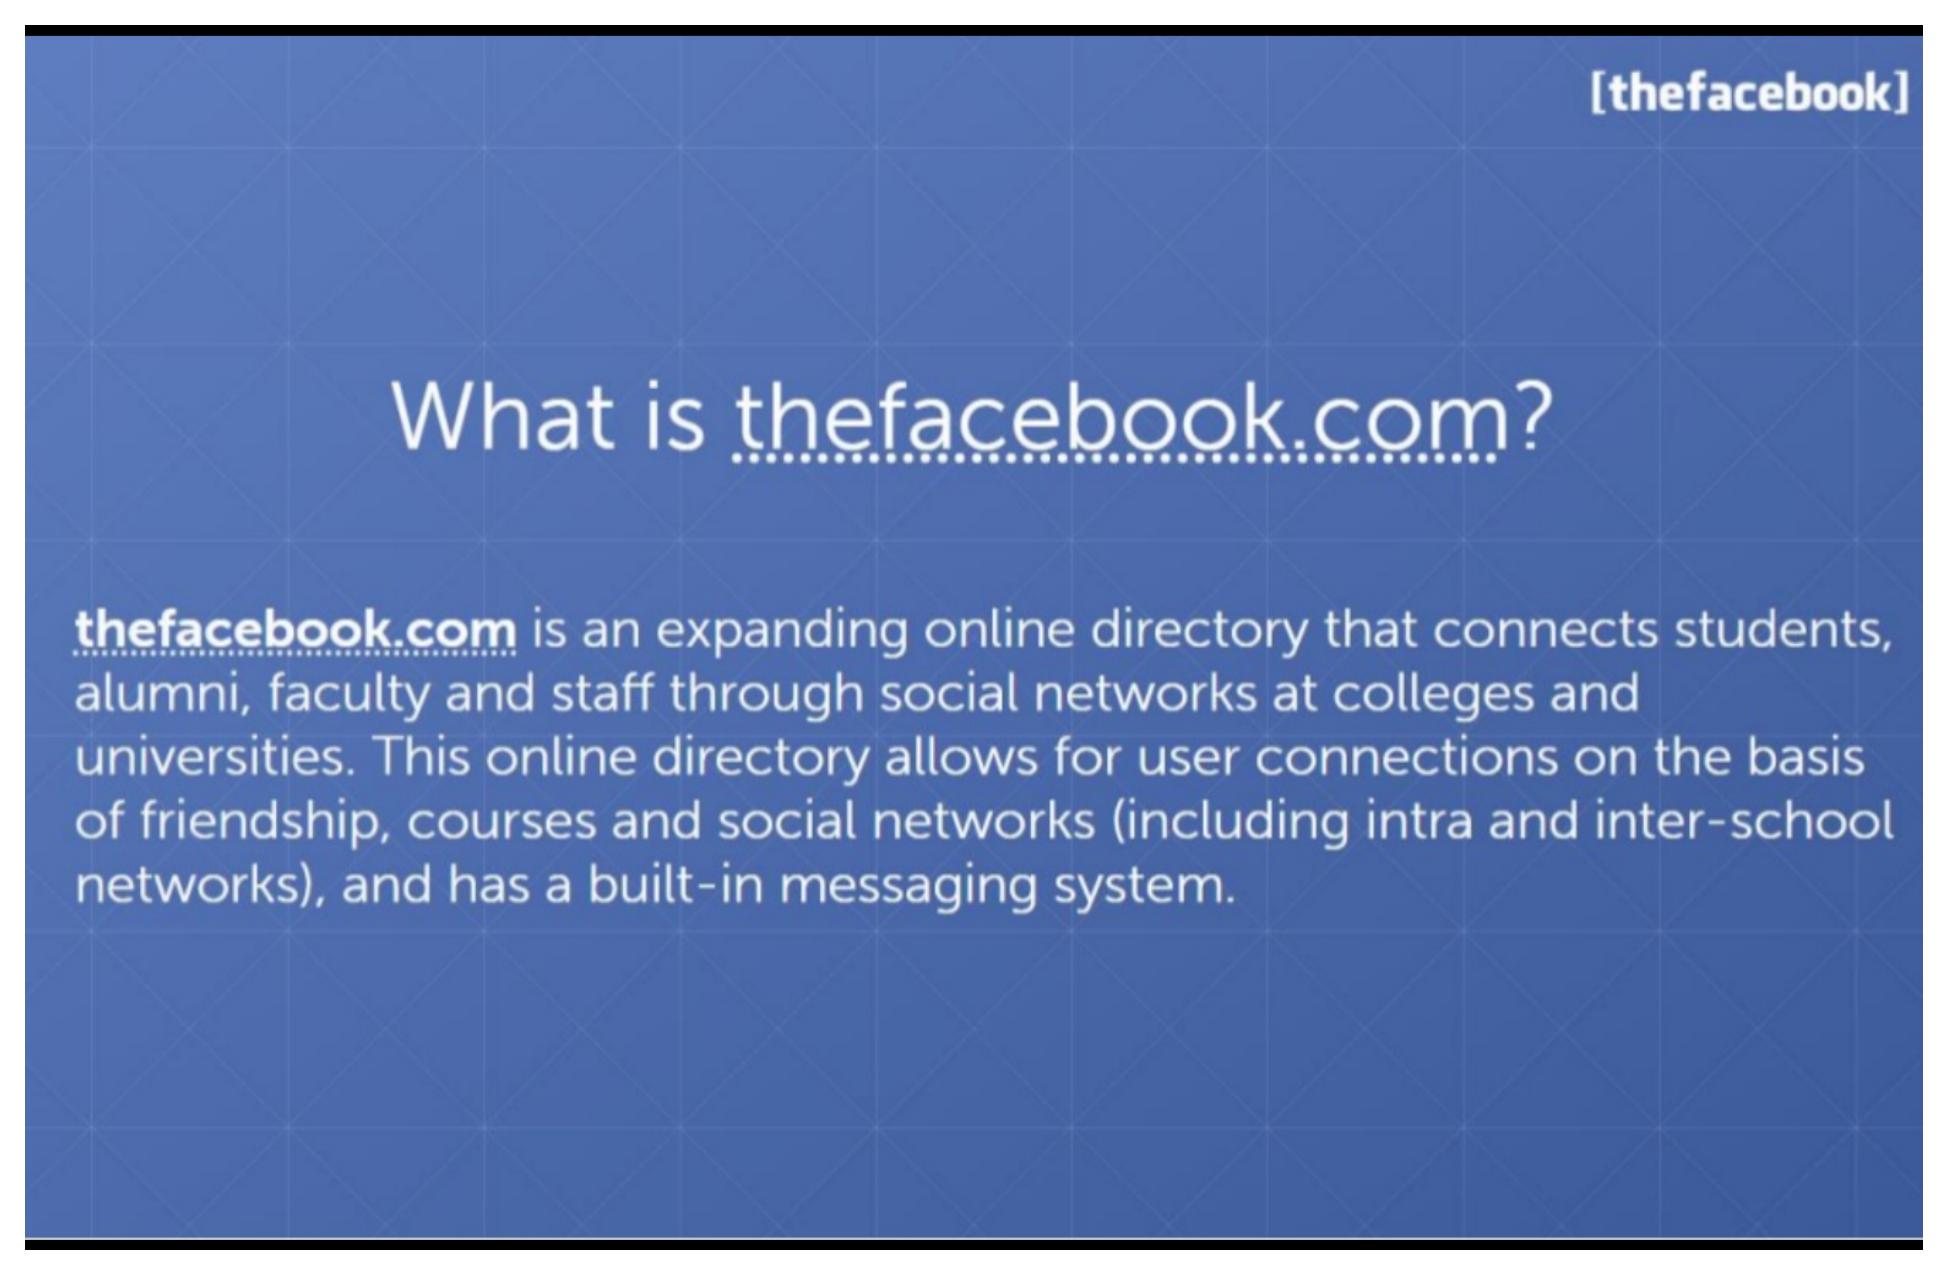
One paragraph defines the category, directory plus social graph, without feature sprawl. Investors and advertisers grasp the model in under ten seconds.
Profiles include contact info, personal details (relationship status, politics, clubs, favorites), auto-built course schedules, and a photo, with a screenshot of Sean Parker's Harvard profile.
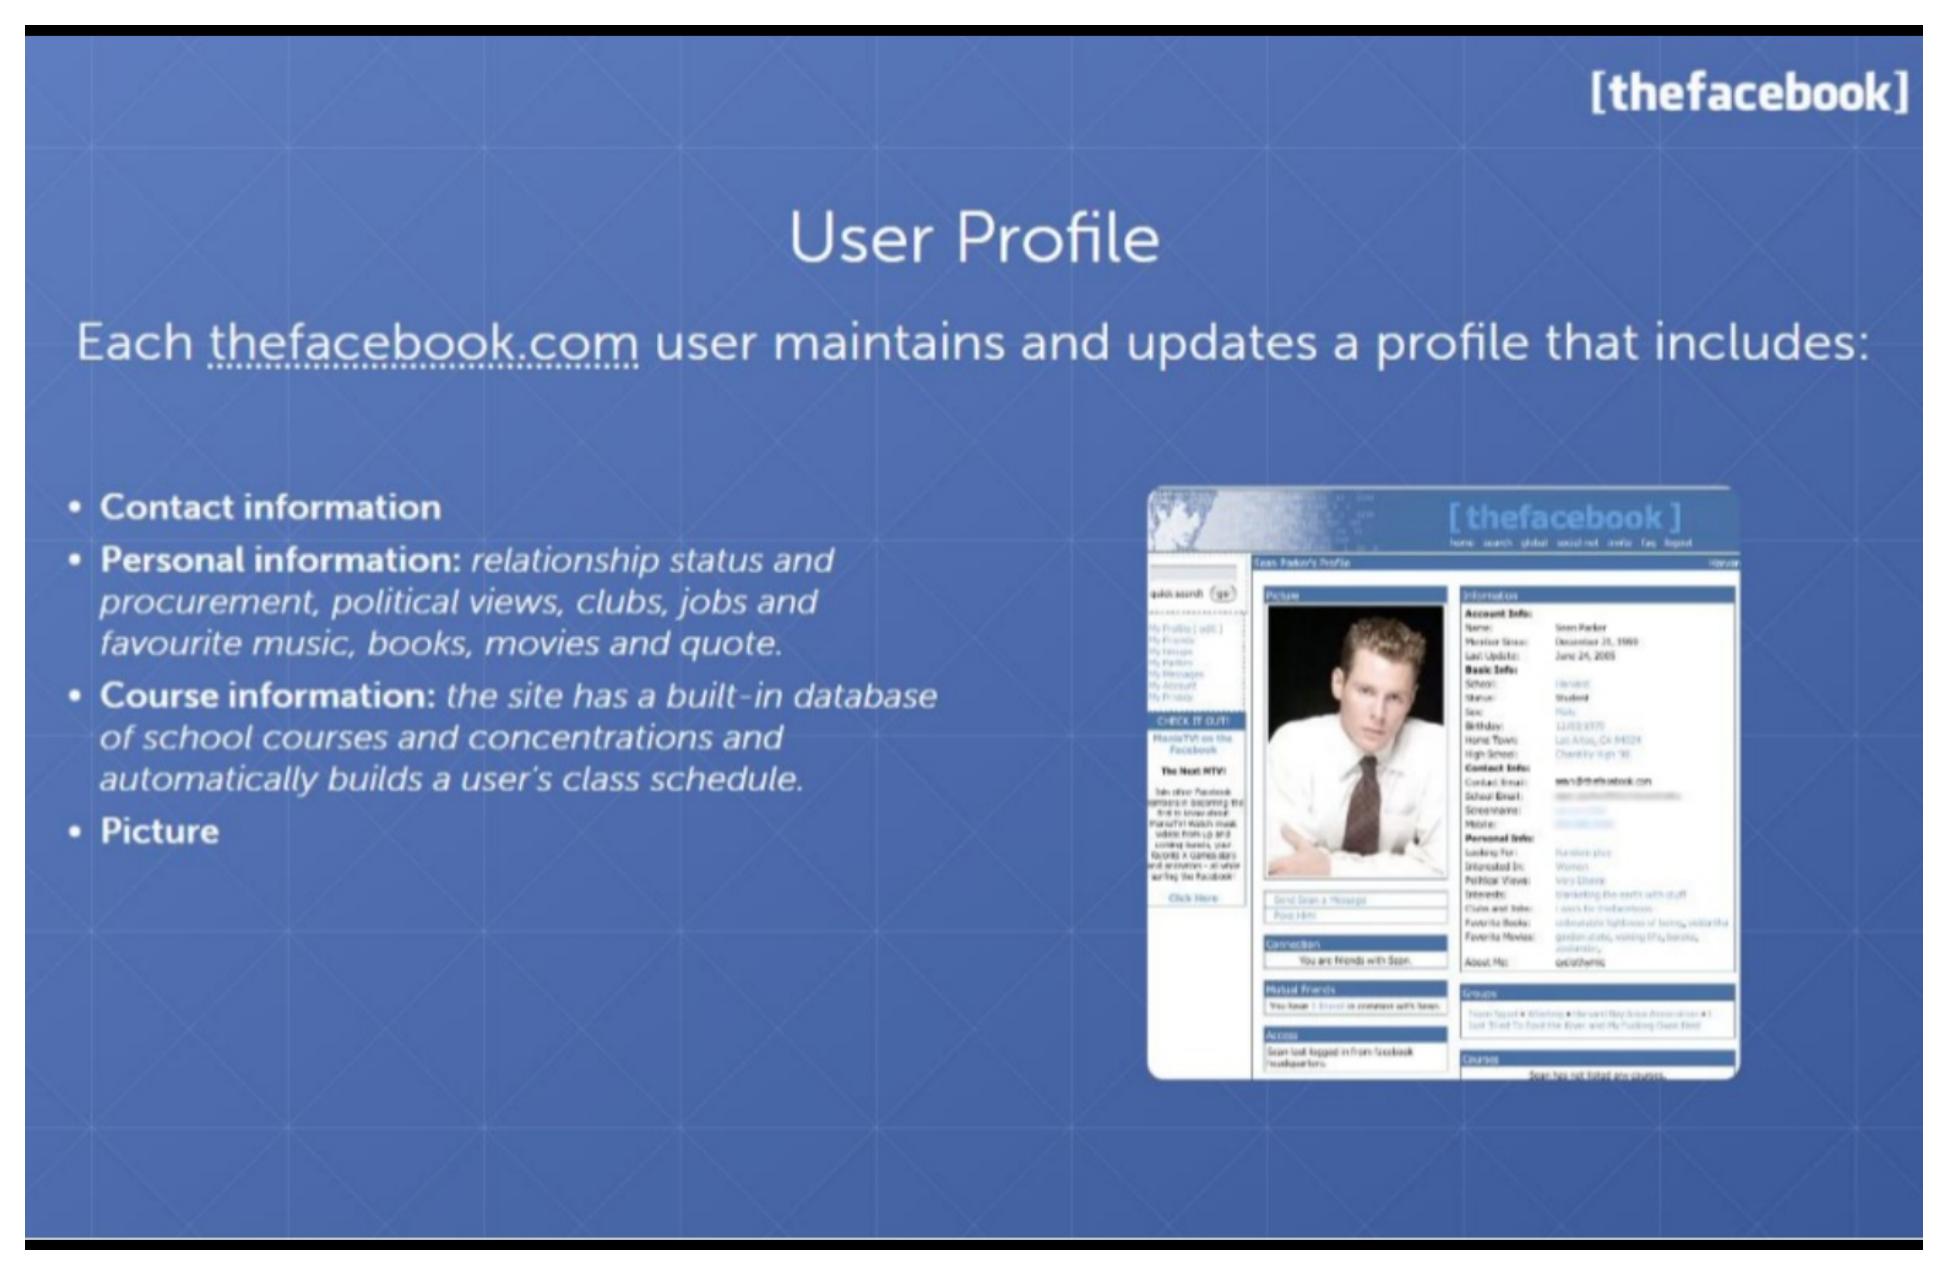
Real product UI on slide five, not mockups. The course database and class schedule automation show domain-specific depth competitors like Friendster lacked.
Profiles auto-link to school news mentioning the user, show last AIM away messages, and last dorm access location via a built-in housing database.
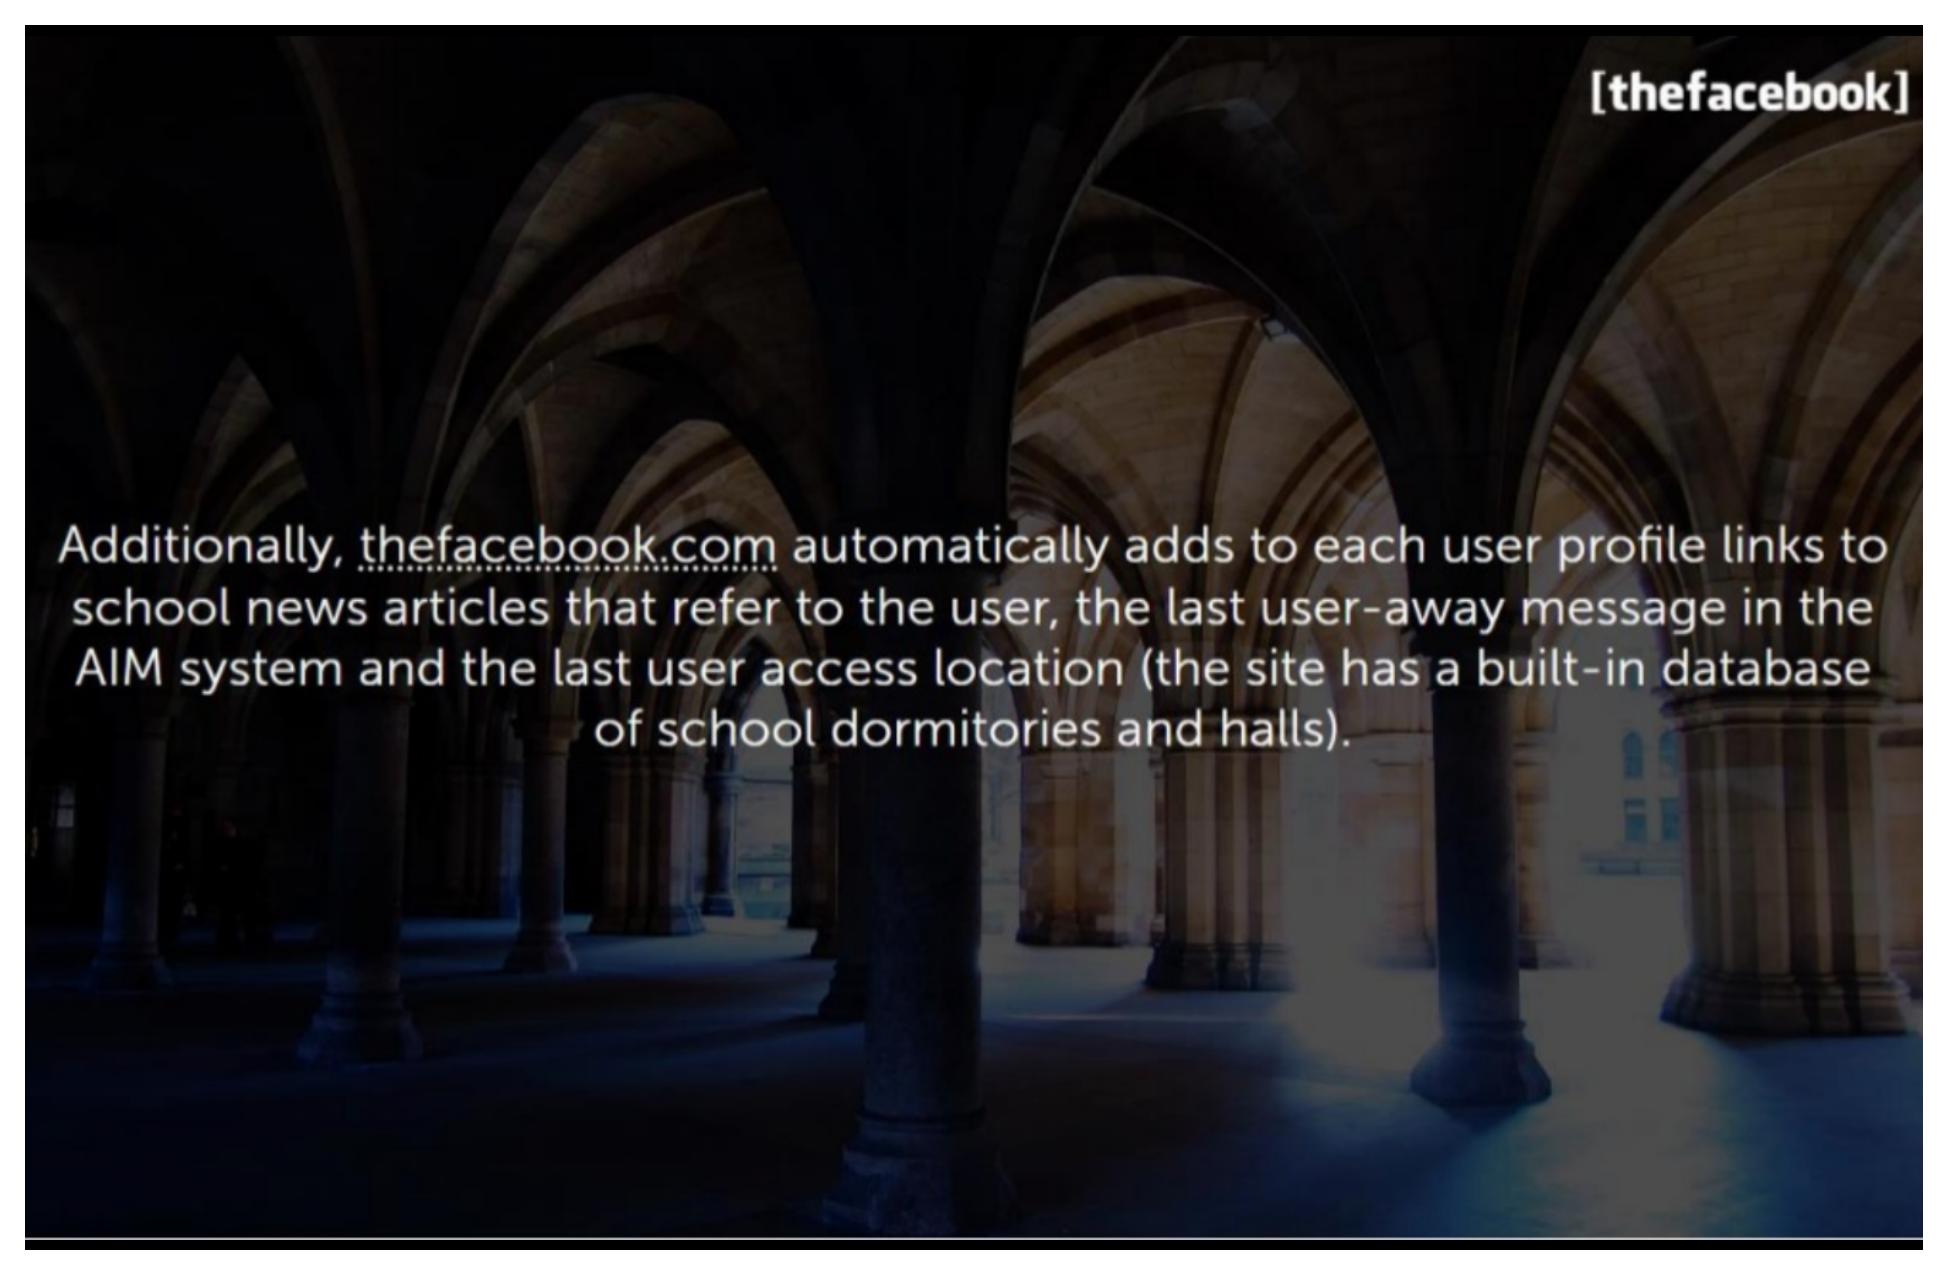
Campus-native integrations (AIM, dorm halls, student papers) make the product feel indispensable to college life, sticky behavior investors could underwrite even without ads yet.
Within-school browsing via Social Net (ten random classmates), Course Rosters, and advanced profile search; verified friend lists with network visualization and friend-of-friend indicators.
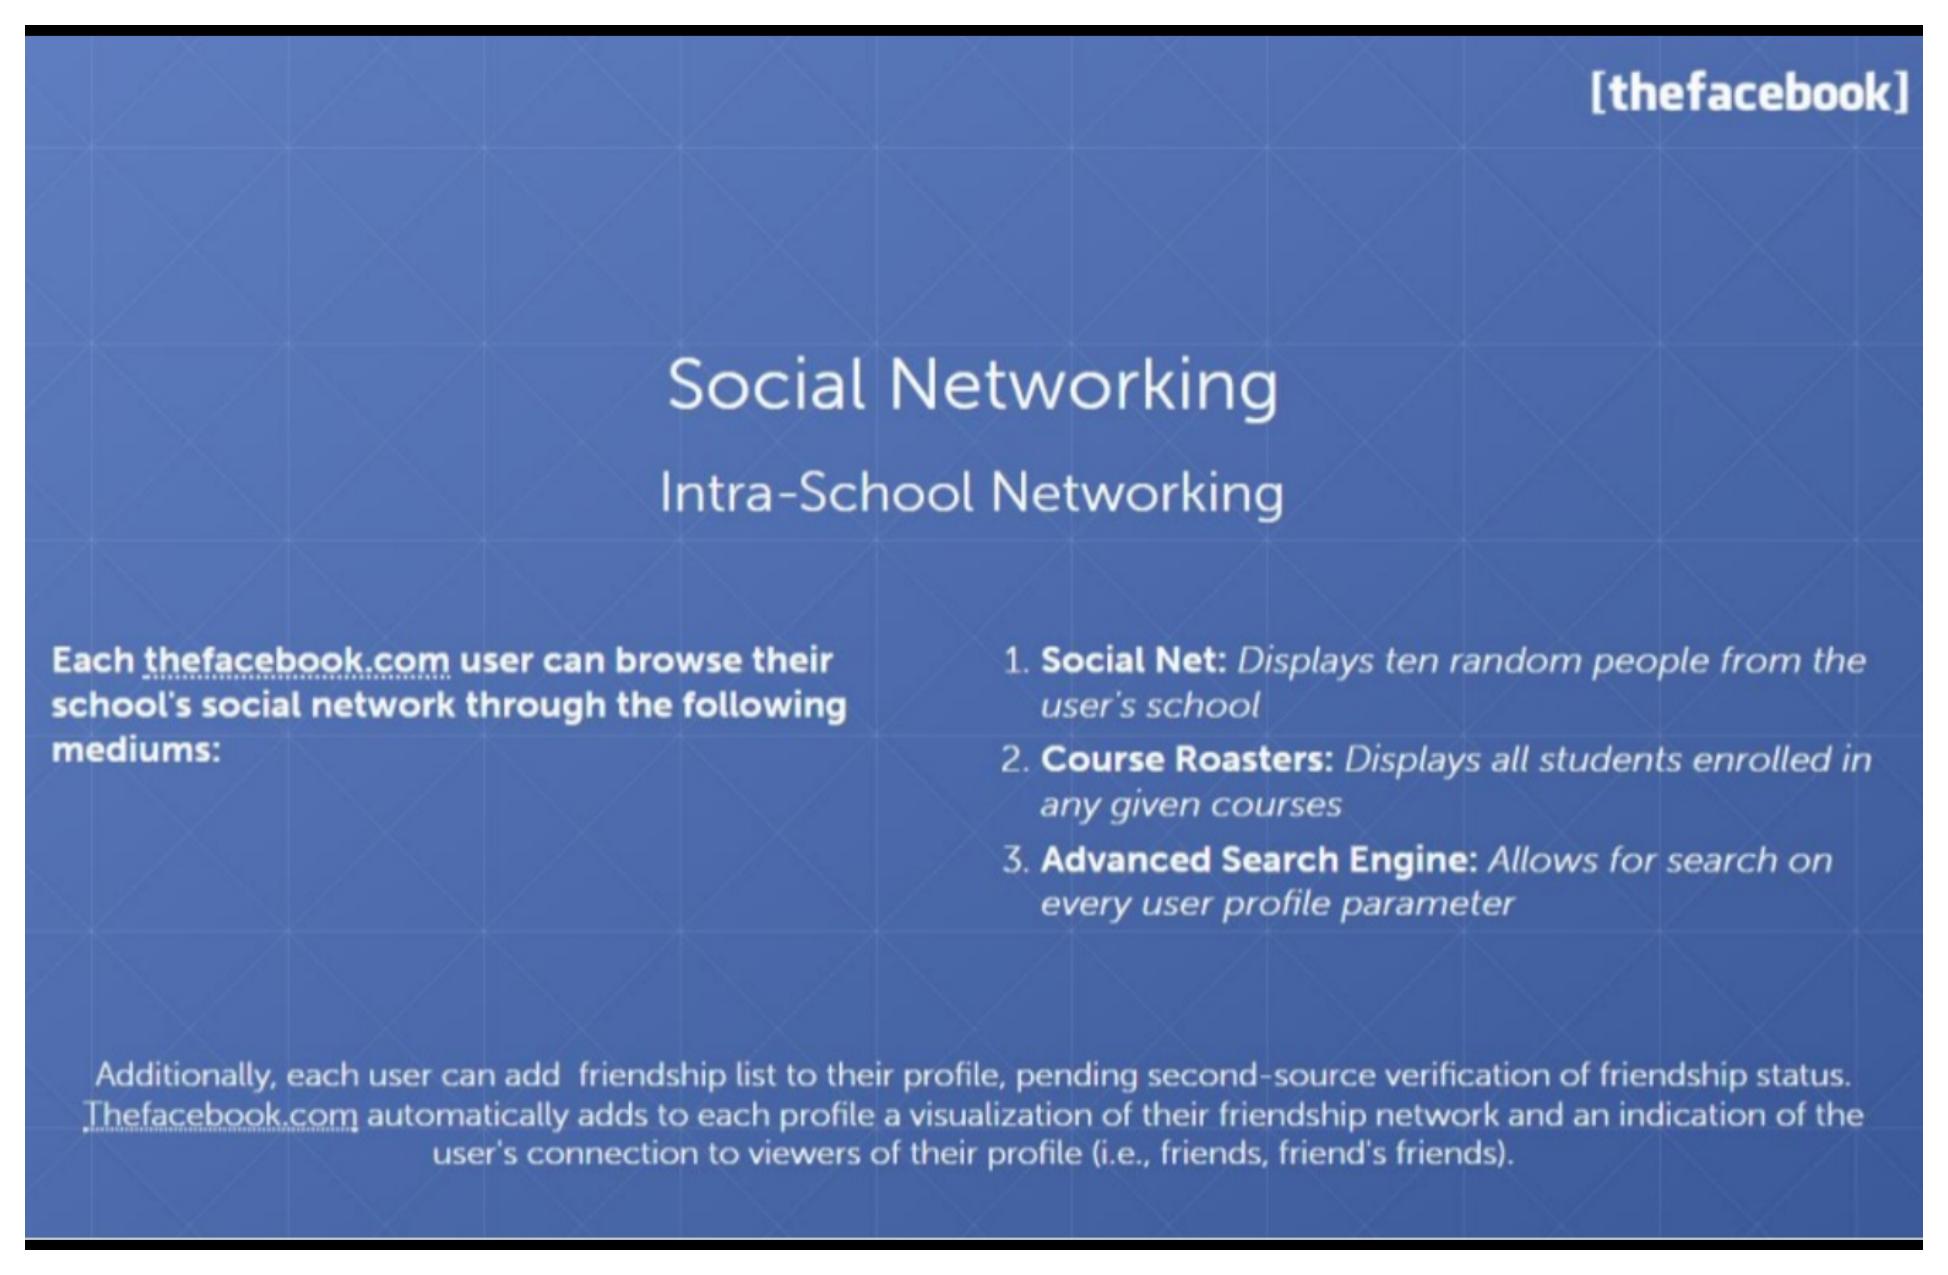
Names three discovery loops that drive daily return visits. Friendship verification and graph visualization were early network-effect mechanics, not cosmetic features.
Global search lets users browse other schools' networks and maintain separate friendship lists per campus in thefacebook.com network.
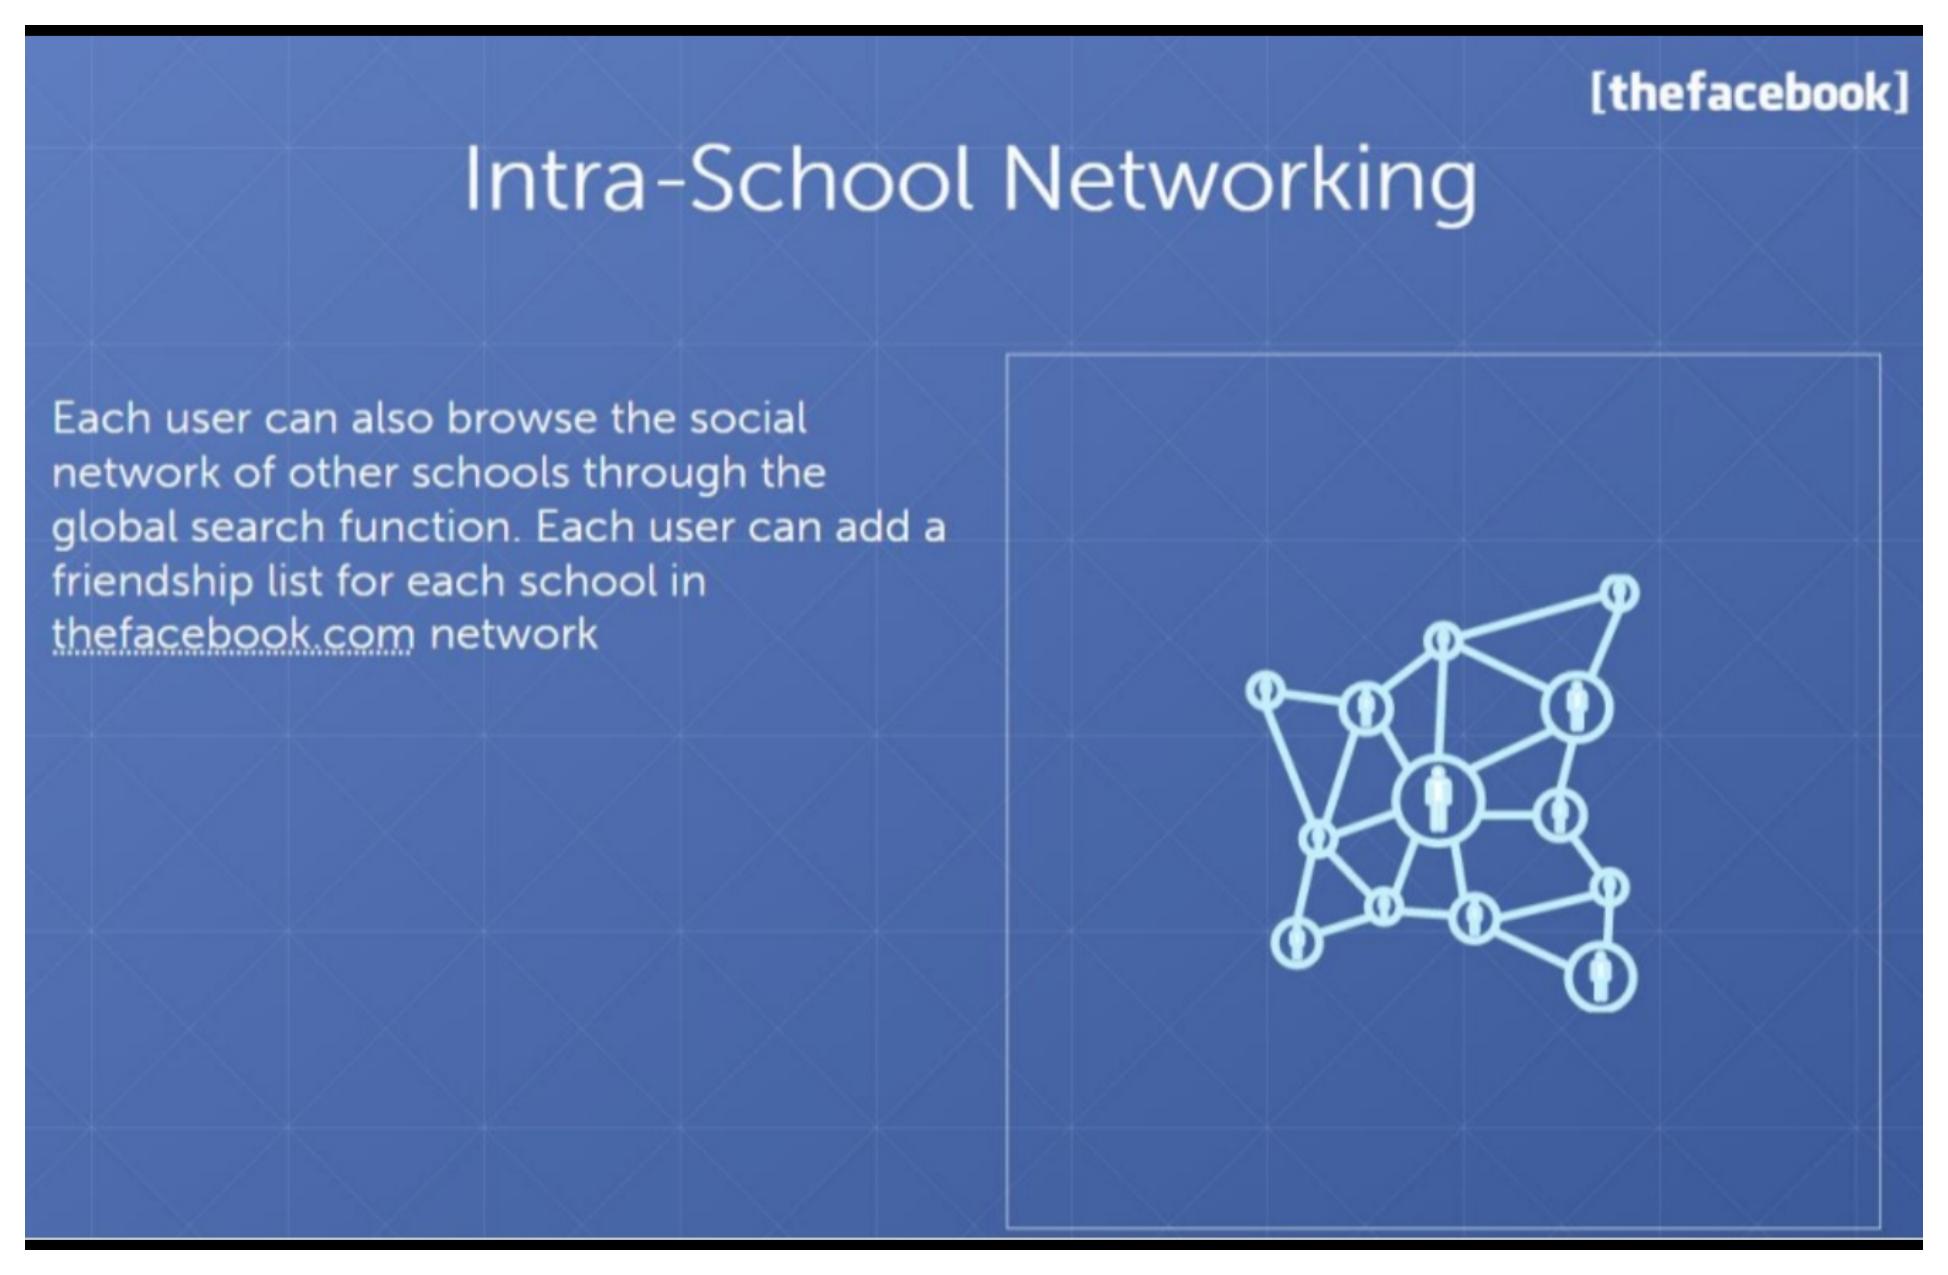
Shows cross-campus reach before national expansion, the product was multi-school from the start, which made the "200 schools by September" goal believable.
Launched February 4, 2004 at Harvard; by April 10 the network lists member schools with launch dates to follow.
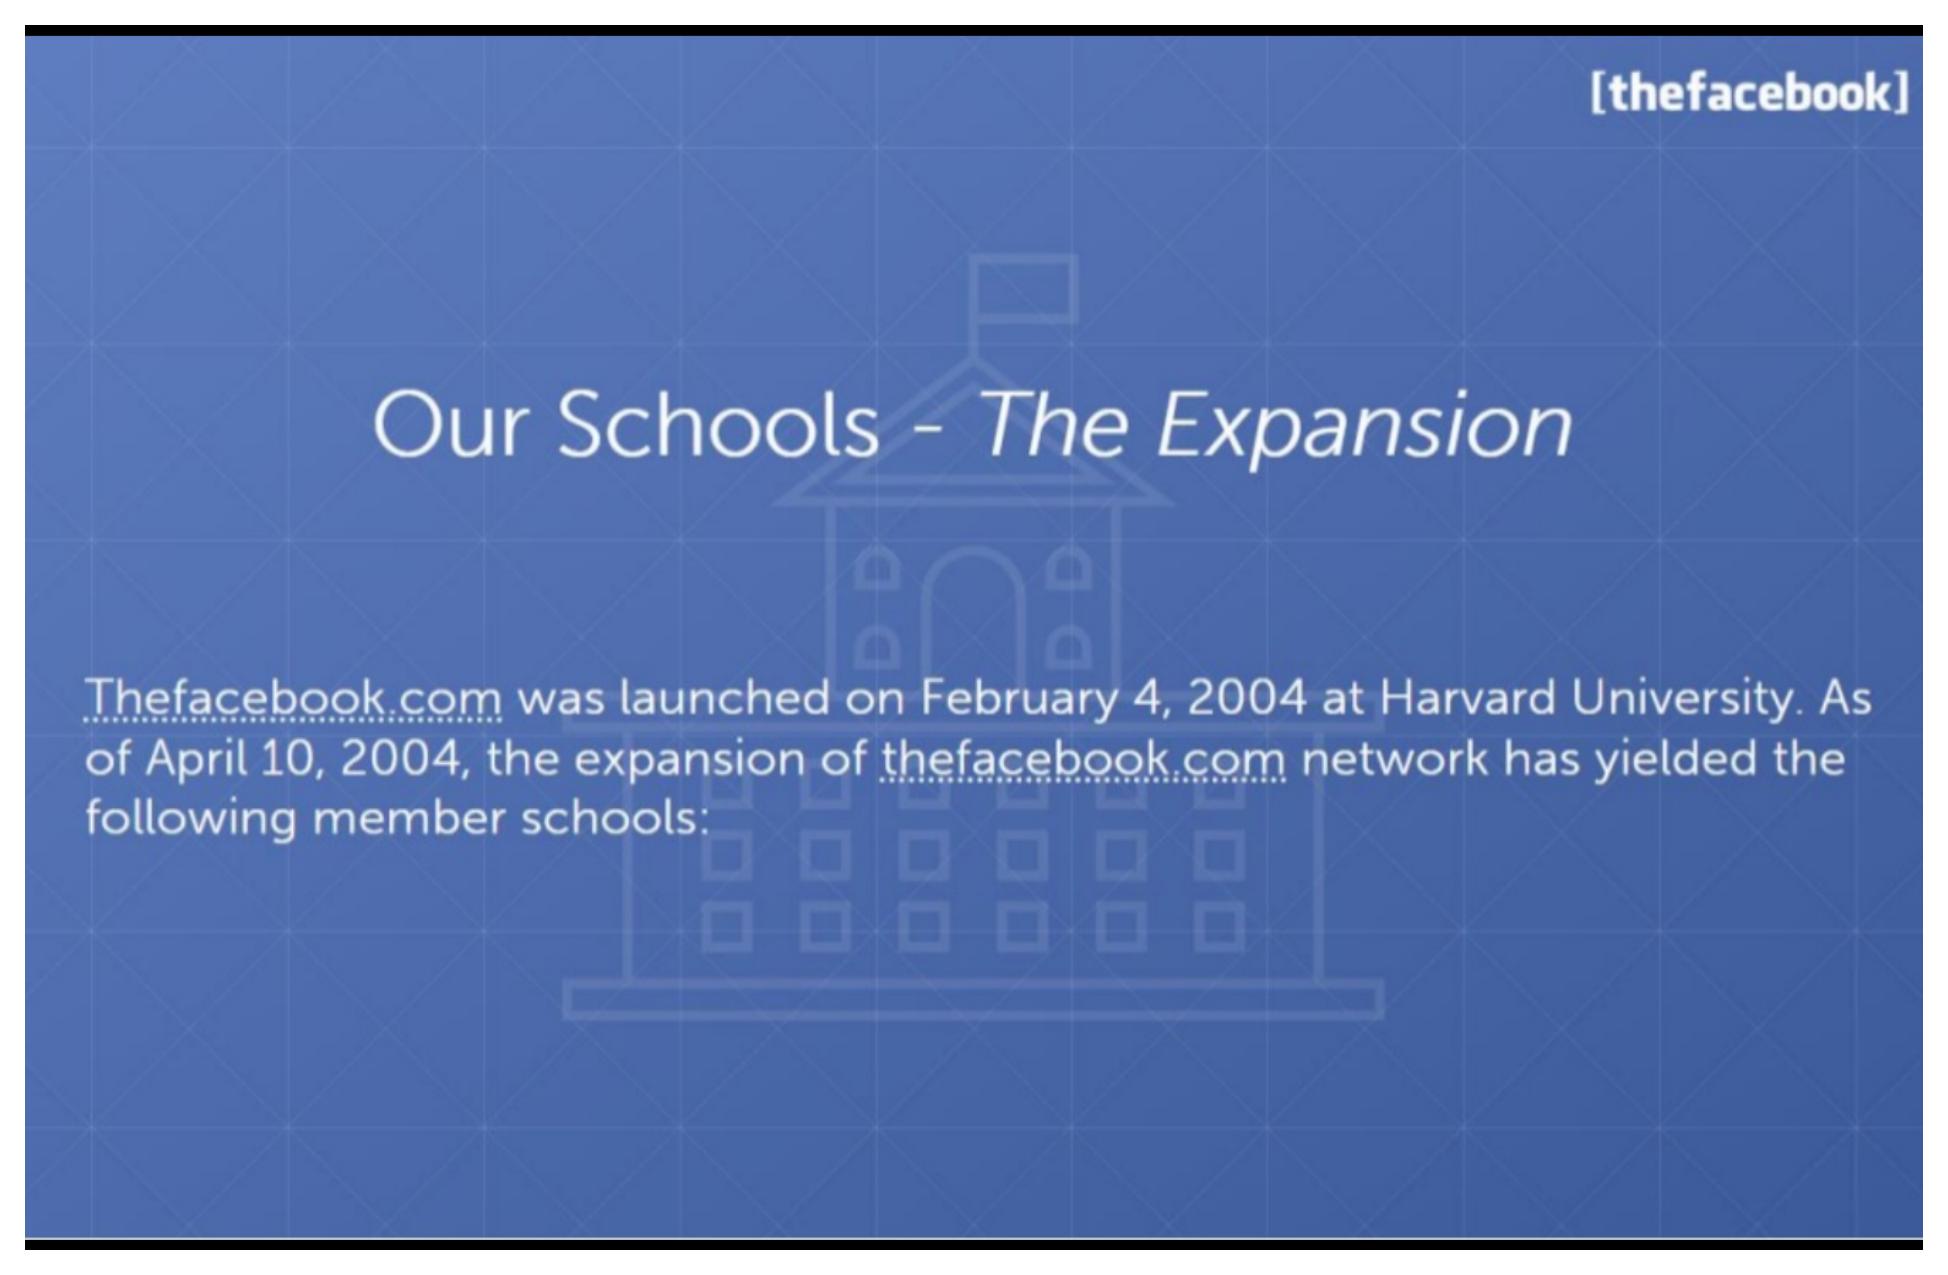
Transition slide sets up traction tables, gives readers context before a wall of school names. Dates prove velocity, not just presence.
Launch dates from Harvard (Feb 4) through Princeton and Brown (Apr 4) for all eight Ivy League universities.
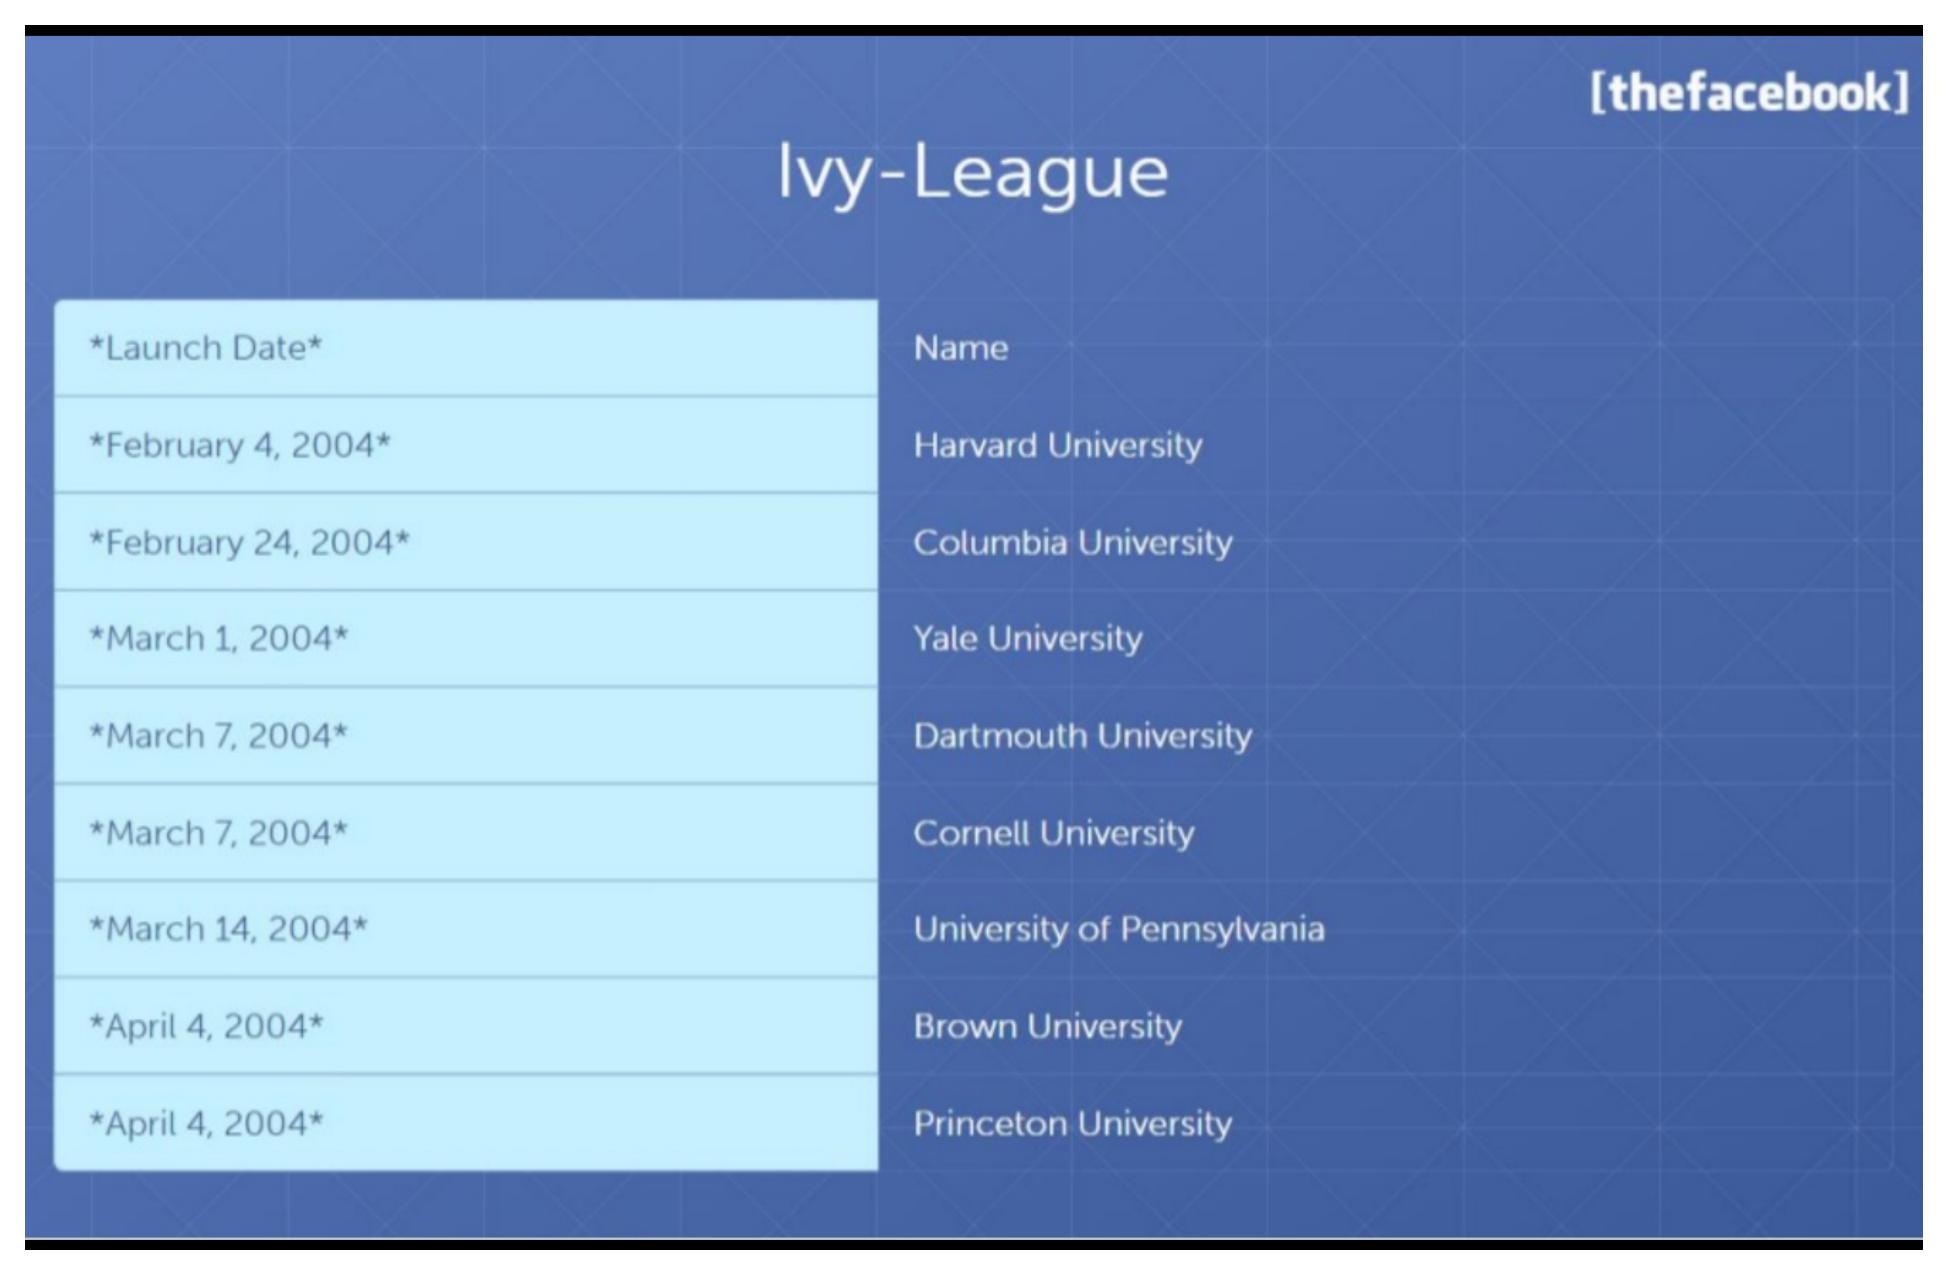
Prestige schools as a wedge. 55% of users would come from Ivy League per later slides. Investors see exclusive, dense campuses conquered in eight weeks.
Stanford, MIT, NYU, BU, UC Berkeley, Duke, Georgetown, UVA, Tufts, Boston College, Northeastern, and Illinois, launches from February through April 2004.
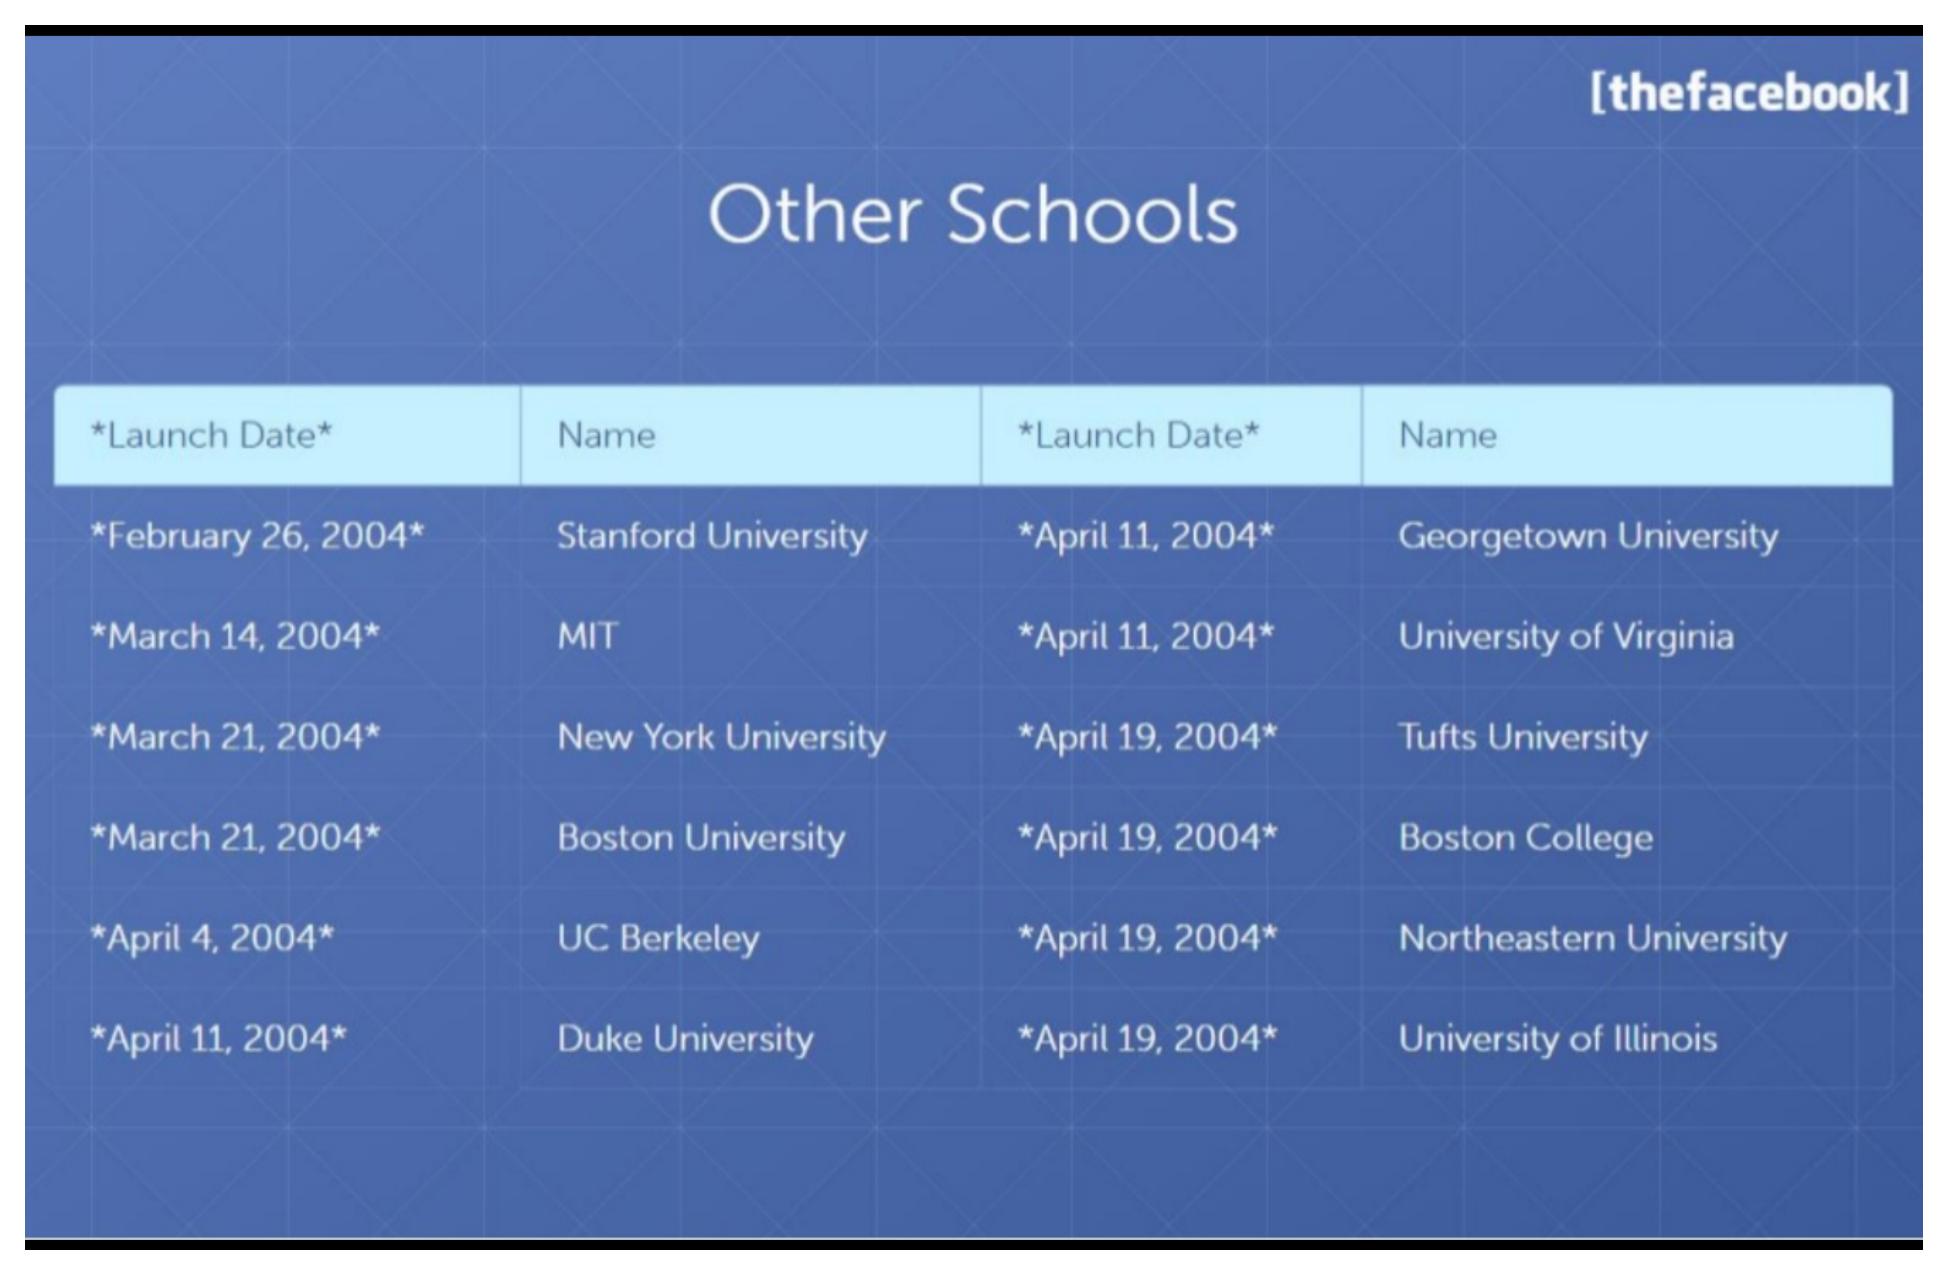
Splits Ivy and non-Ivy tables so the list stays scannable. Proves the playbook works beyond the East Coast elite bubble.
Mission to include most U.S, colleges; target of more than 200 member schools by September 1, 2004.
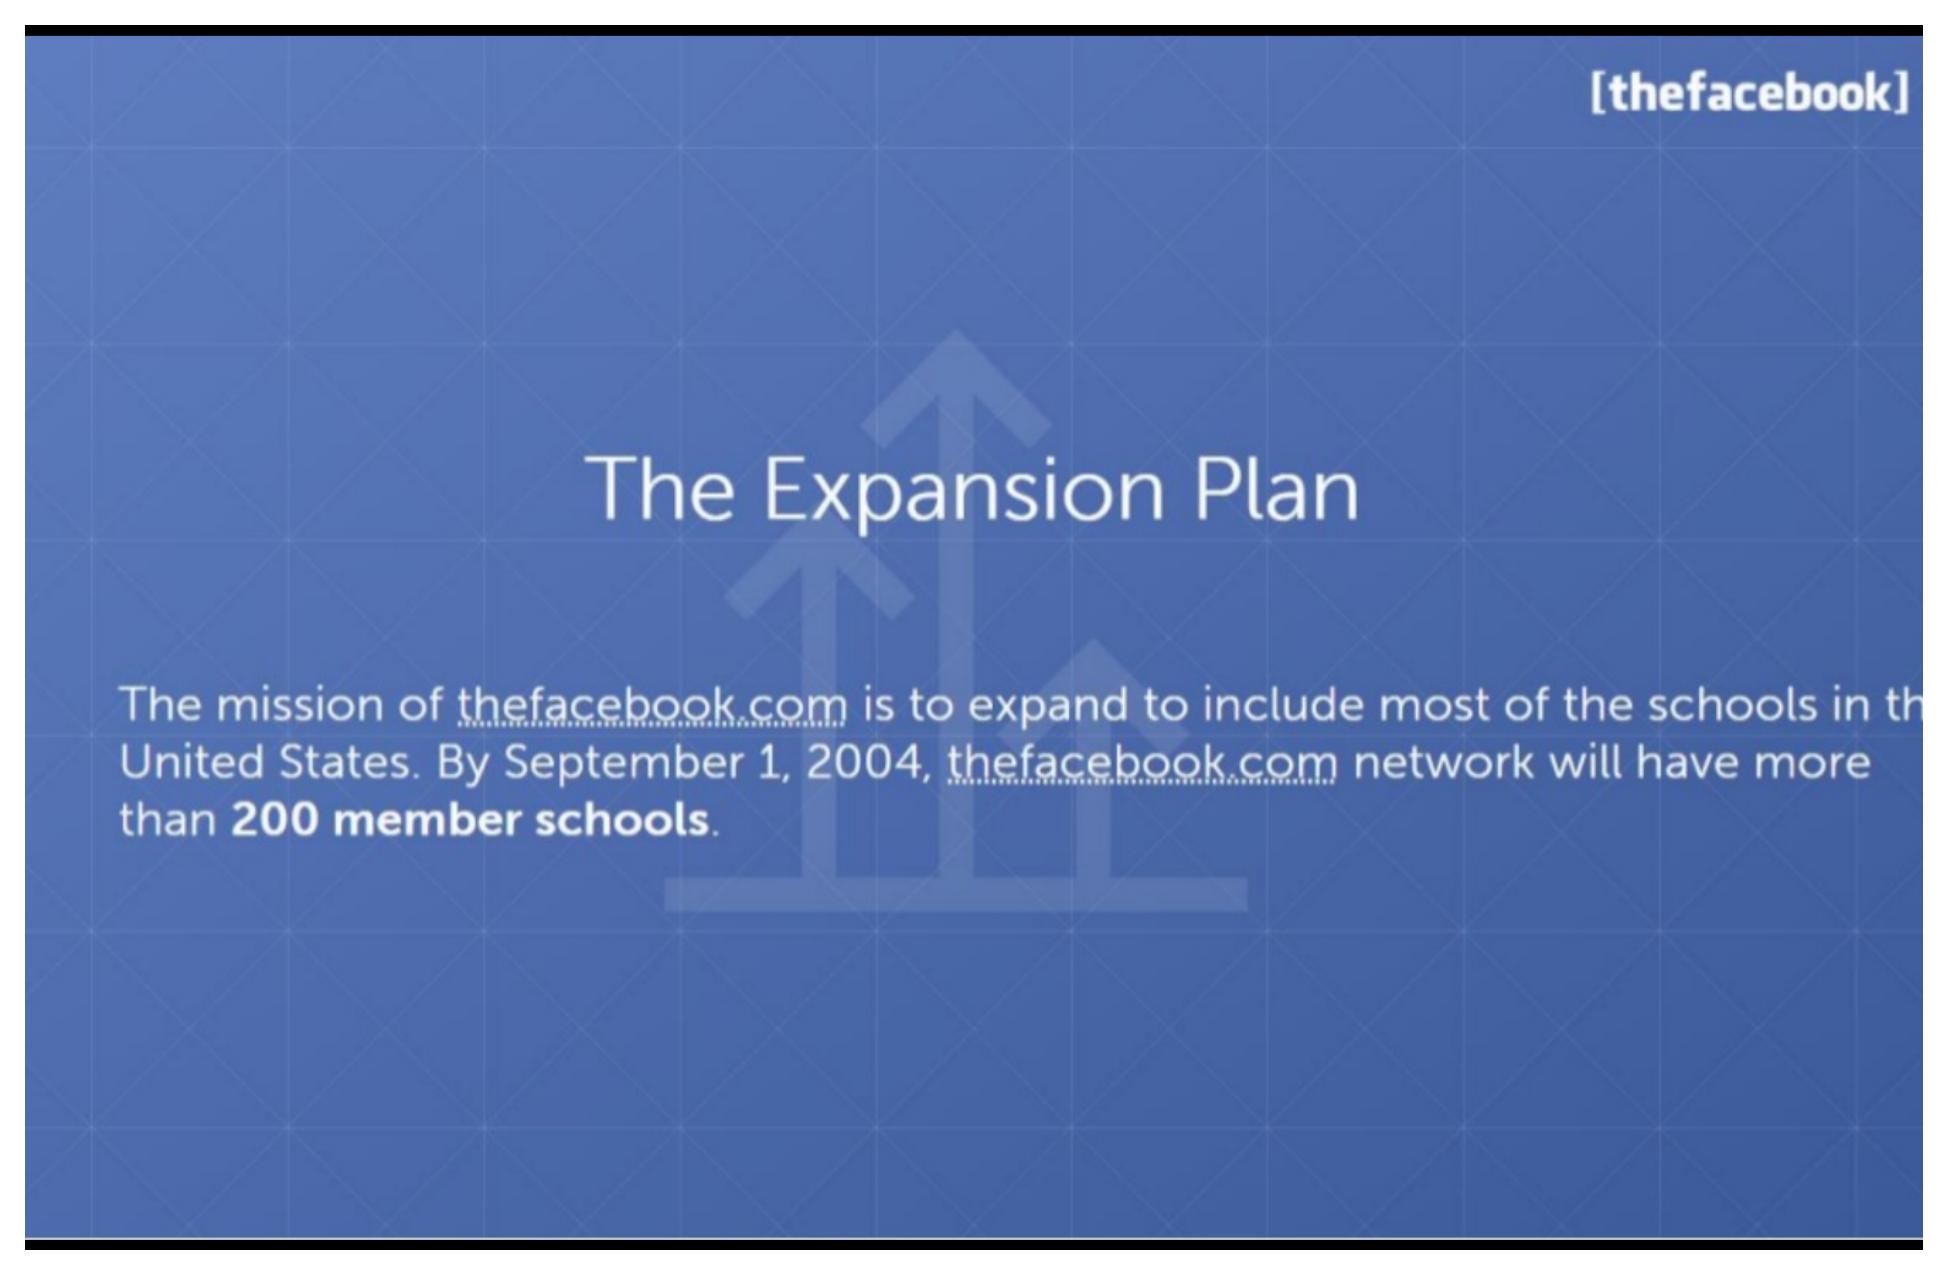
Specific deadline plus numeric goal, investors and advertisers can hold the team accountable. Ambition is stated as a rollout plan, not TAM hand-waving.
15 million U.S, college students with $85B+ purchasing power. $21B on food, $9B on autos, $5B on clothes, $4B on phones, plus active job seekers.
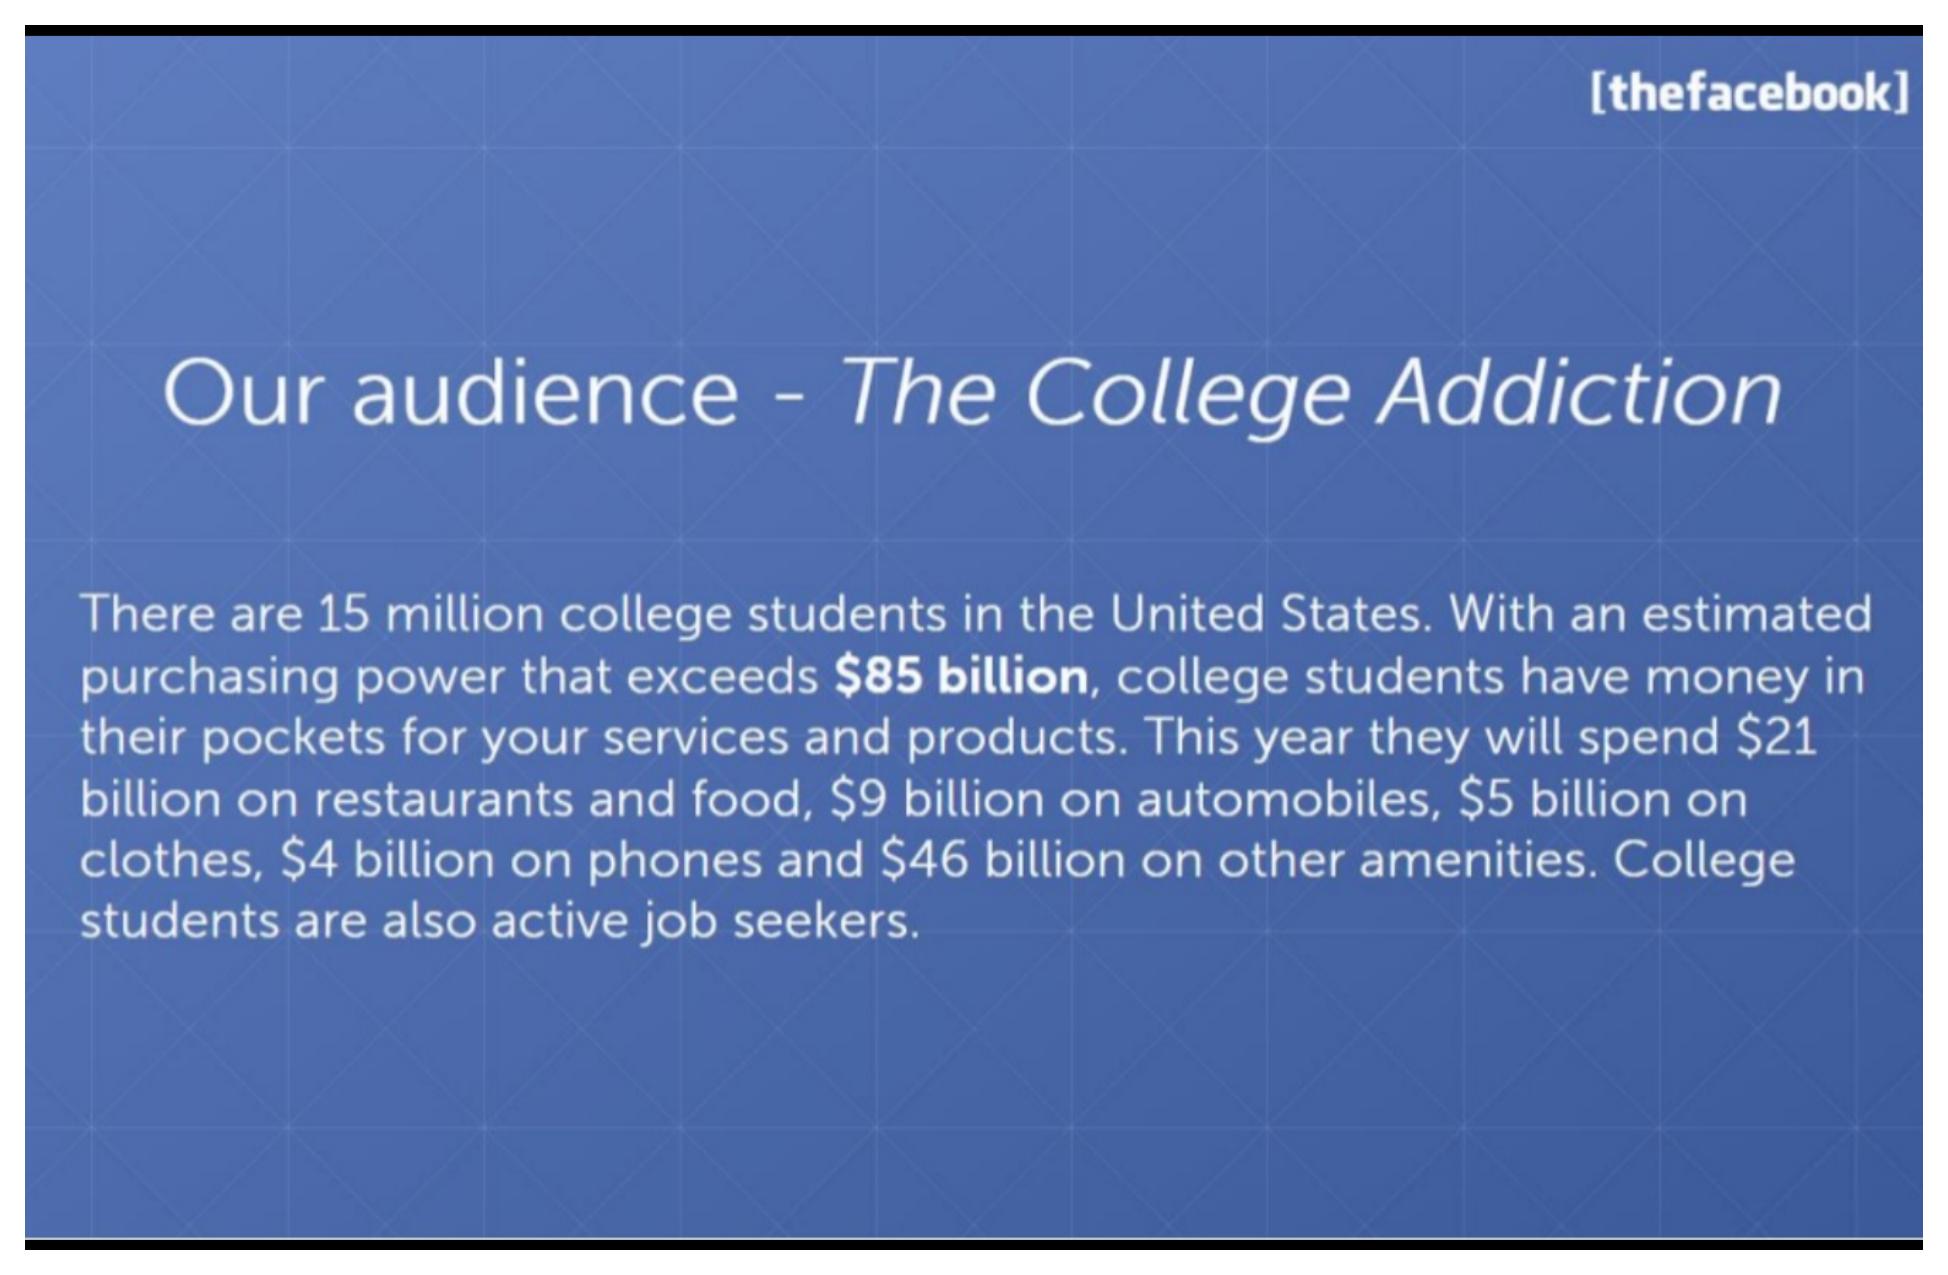
Market size for advertisers, not VCs, ties eyeballs to wallet size. The "college addiction" framing matches the opening press quote narrative.
70,000 total students, pie chart split 55% Ivy-League schools vs 45% other schools (*March 2004 stats).
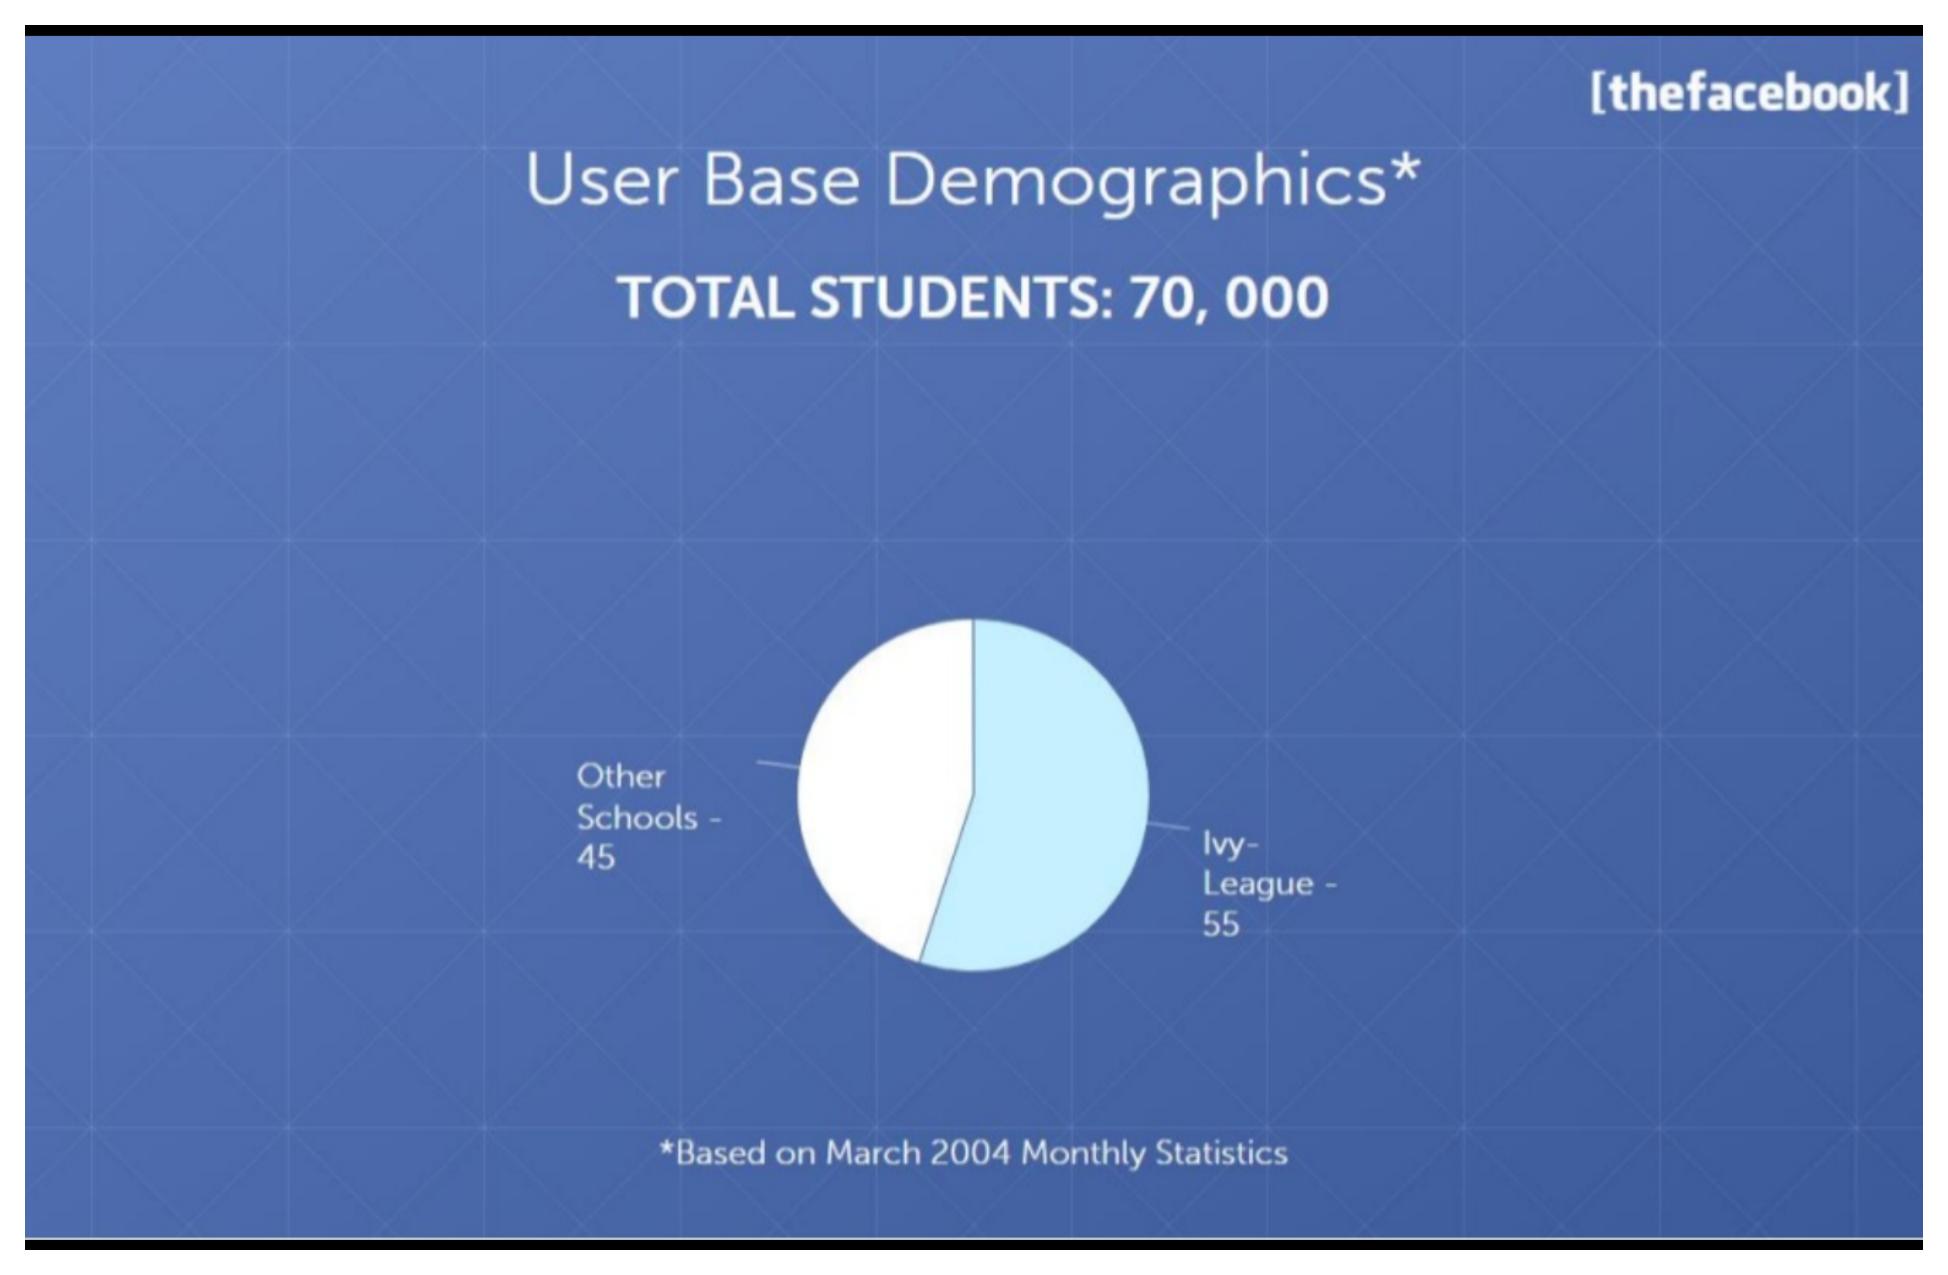
First of three demographic slides; school mix shows premium density without ignoring broader rollout. Footnote dates the data so numbers feel audited, not inflated.
Same 70,000 student base. 87% students, 11% alumni, 2% faculty-staff (*March 2004).
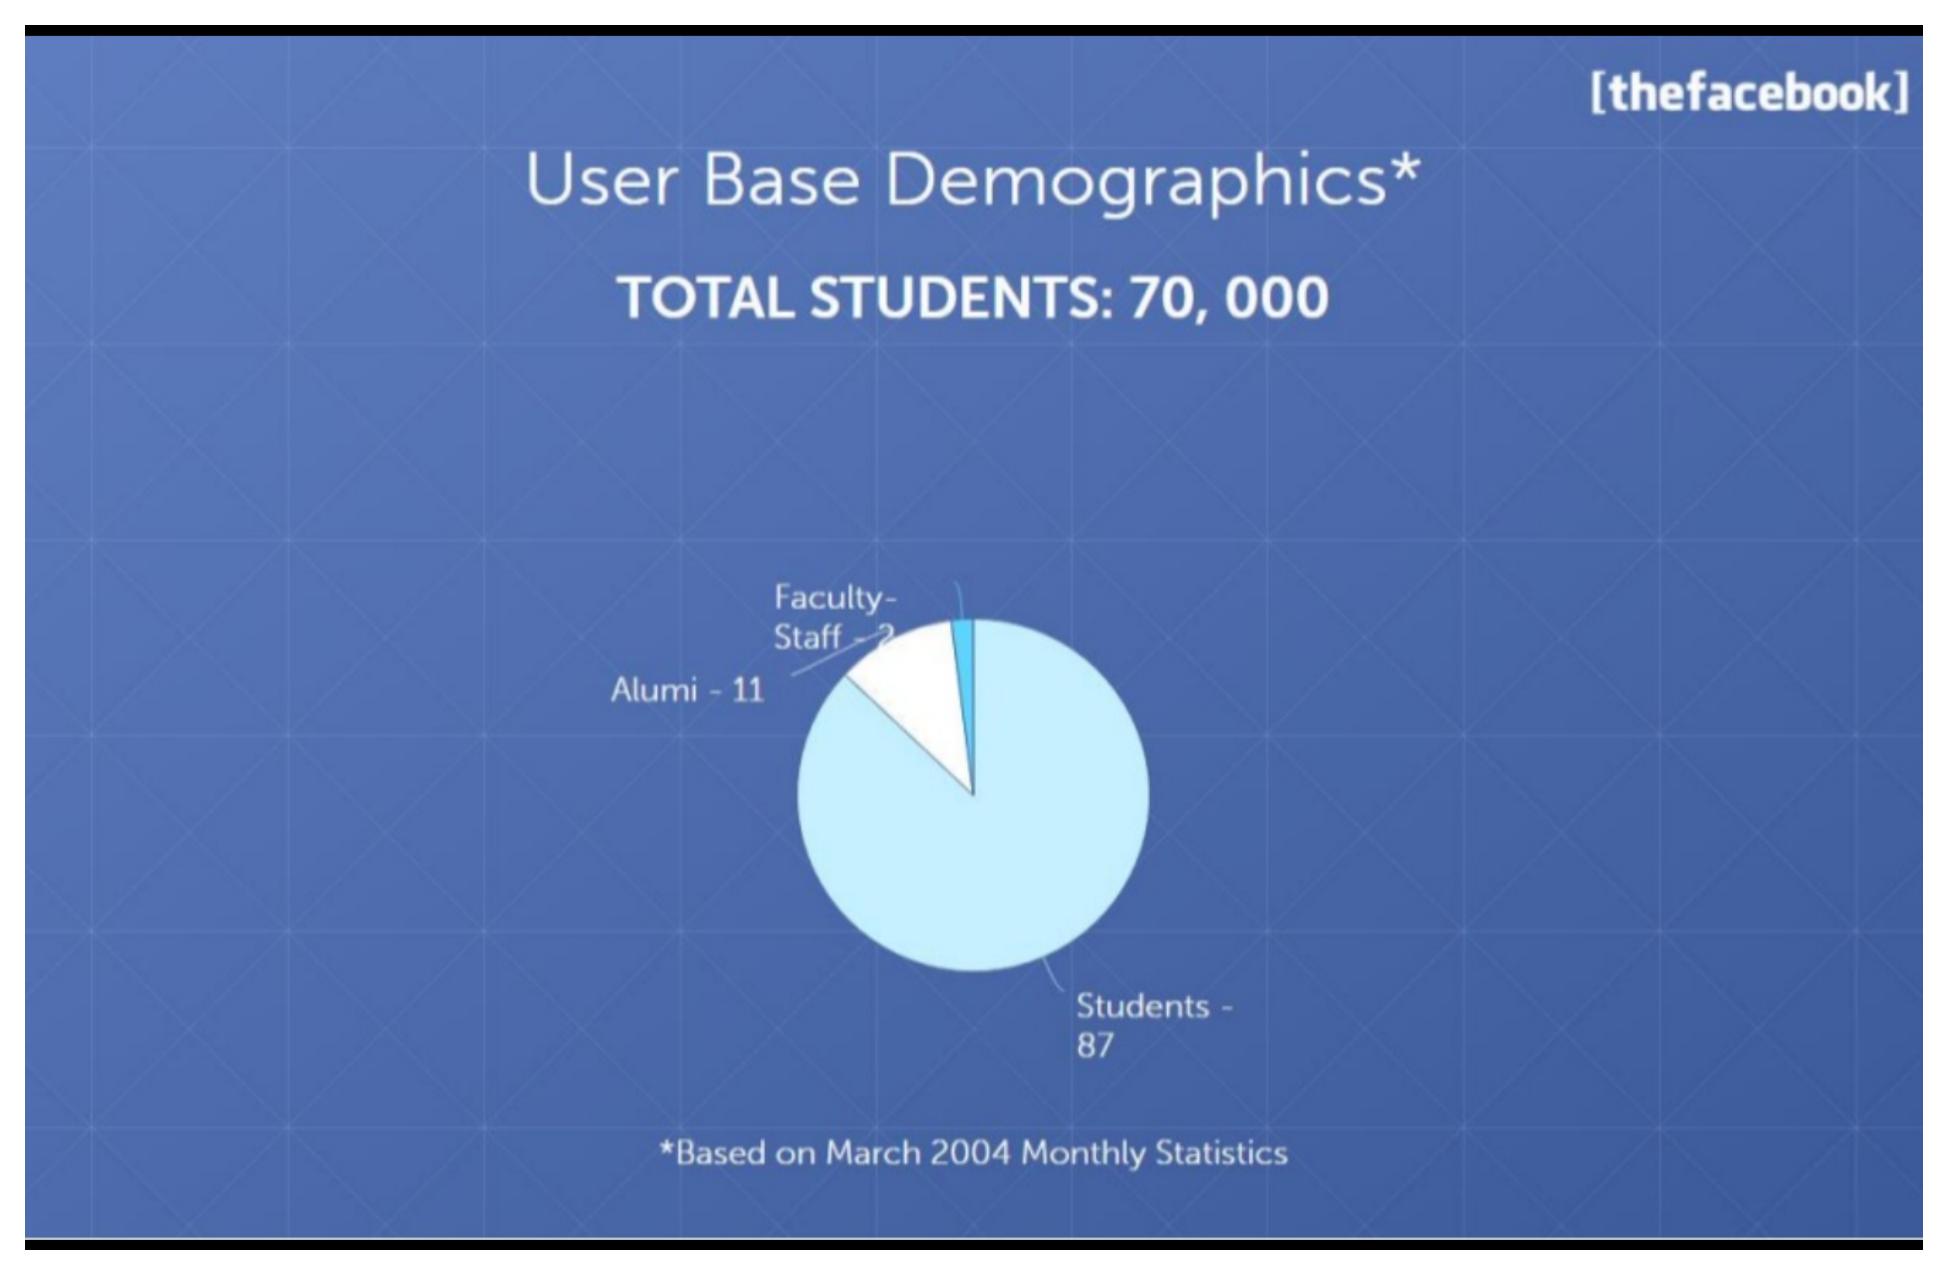
Role breakdown confirms the core user is still enrolled, alumni share hints at lifecycle value without diluting the student-focused ad pitch.
Gender split 48% men / 52% women; 92% aged 18–24, with playful restroom and keg-stand icons (*March 2004).
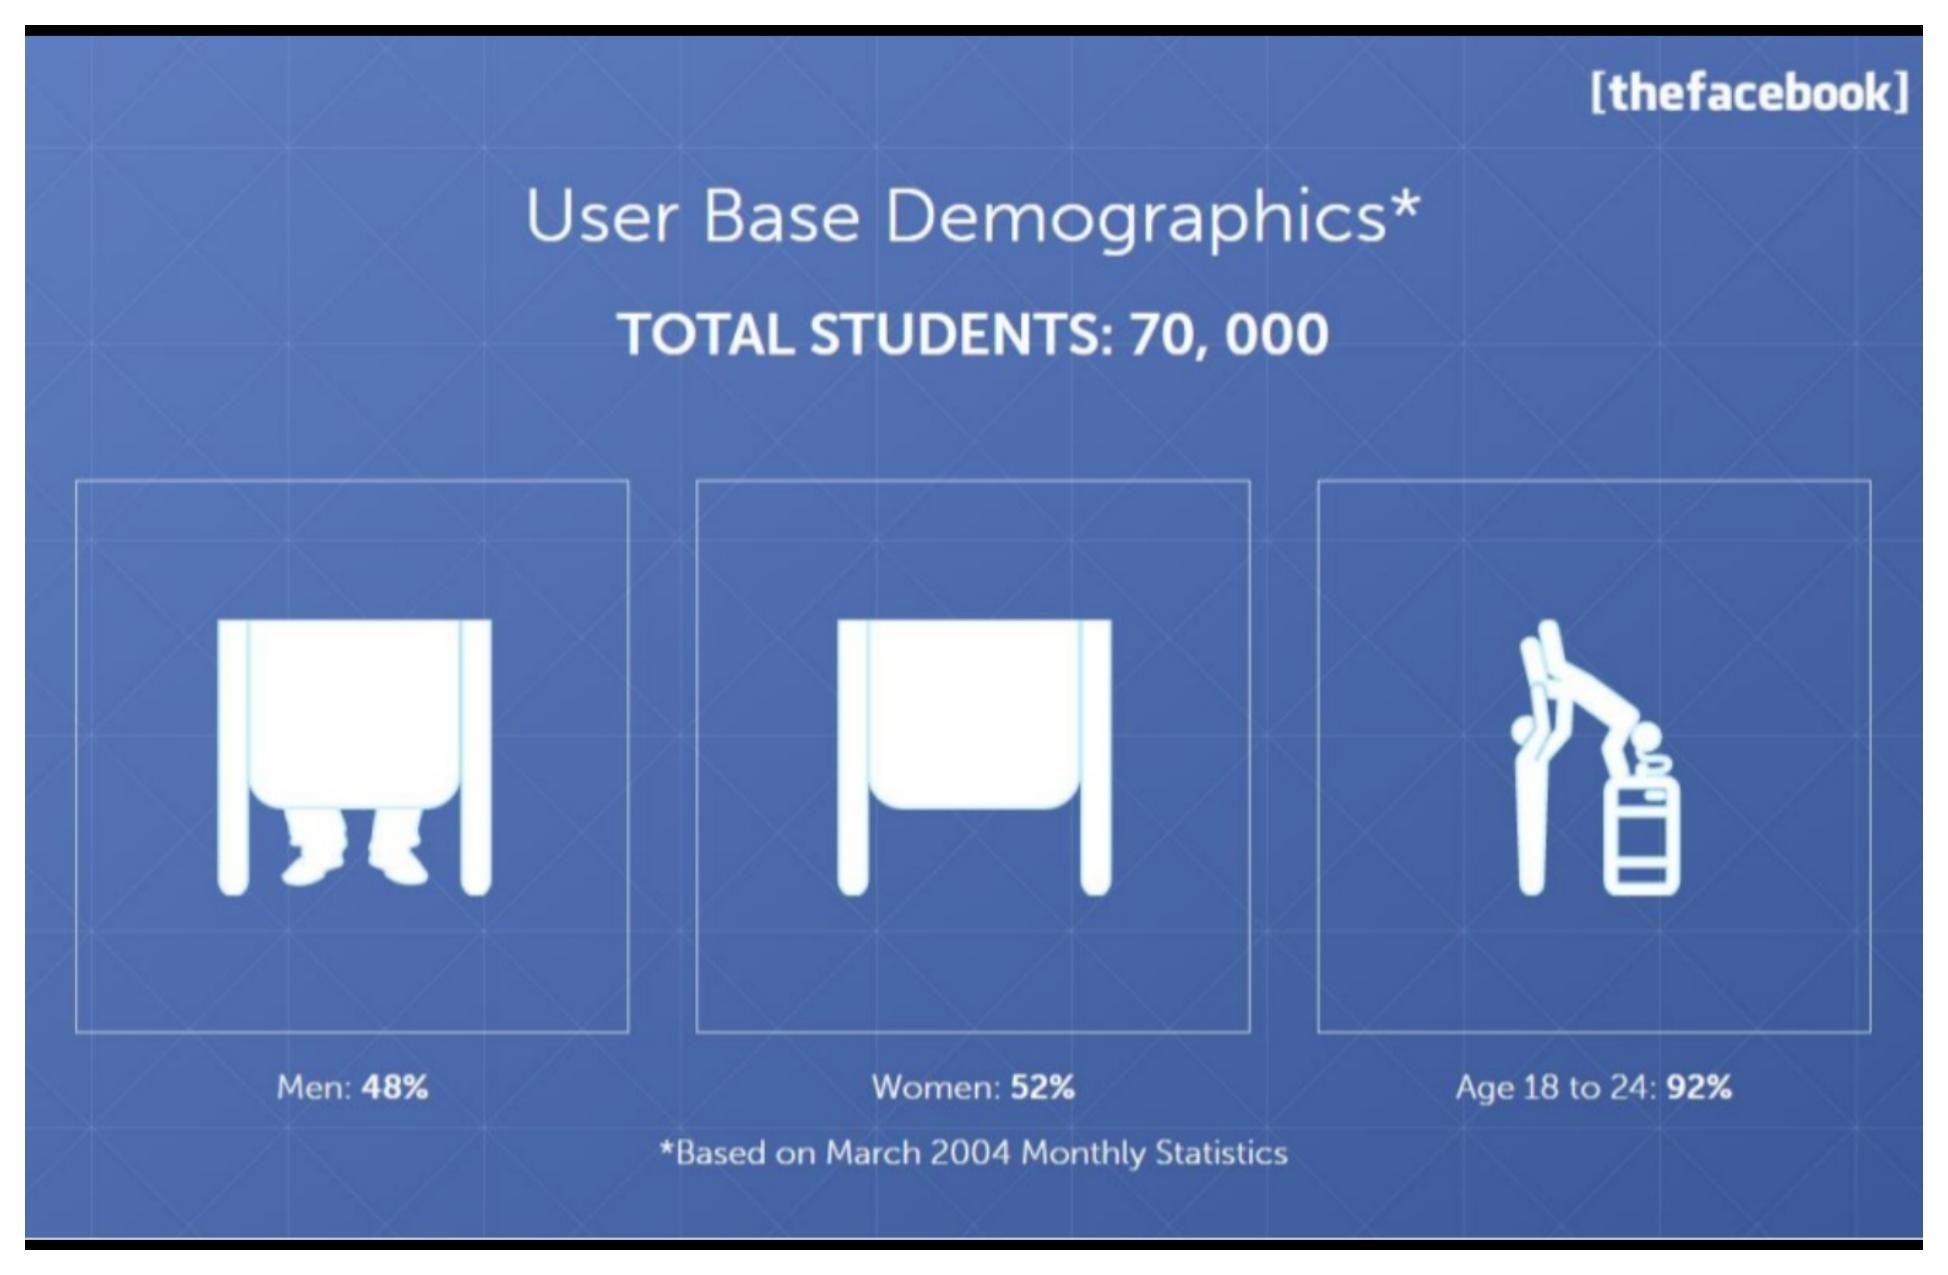
Demographics advertisers care about, gender balance and age band, delivered with campus humor that matches the brand tone without hiding the data.
65% daily unique users, 95% monthly unique users, and 3 million daily pageviews among 70,000 students (*March 2004).
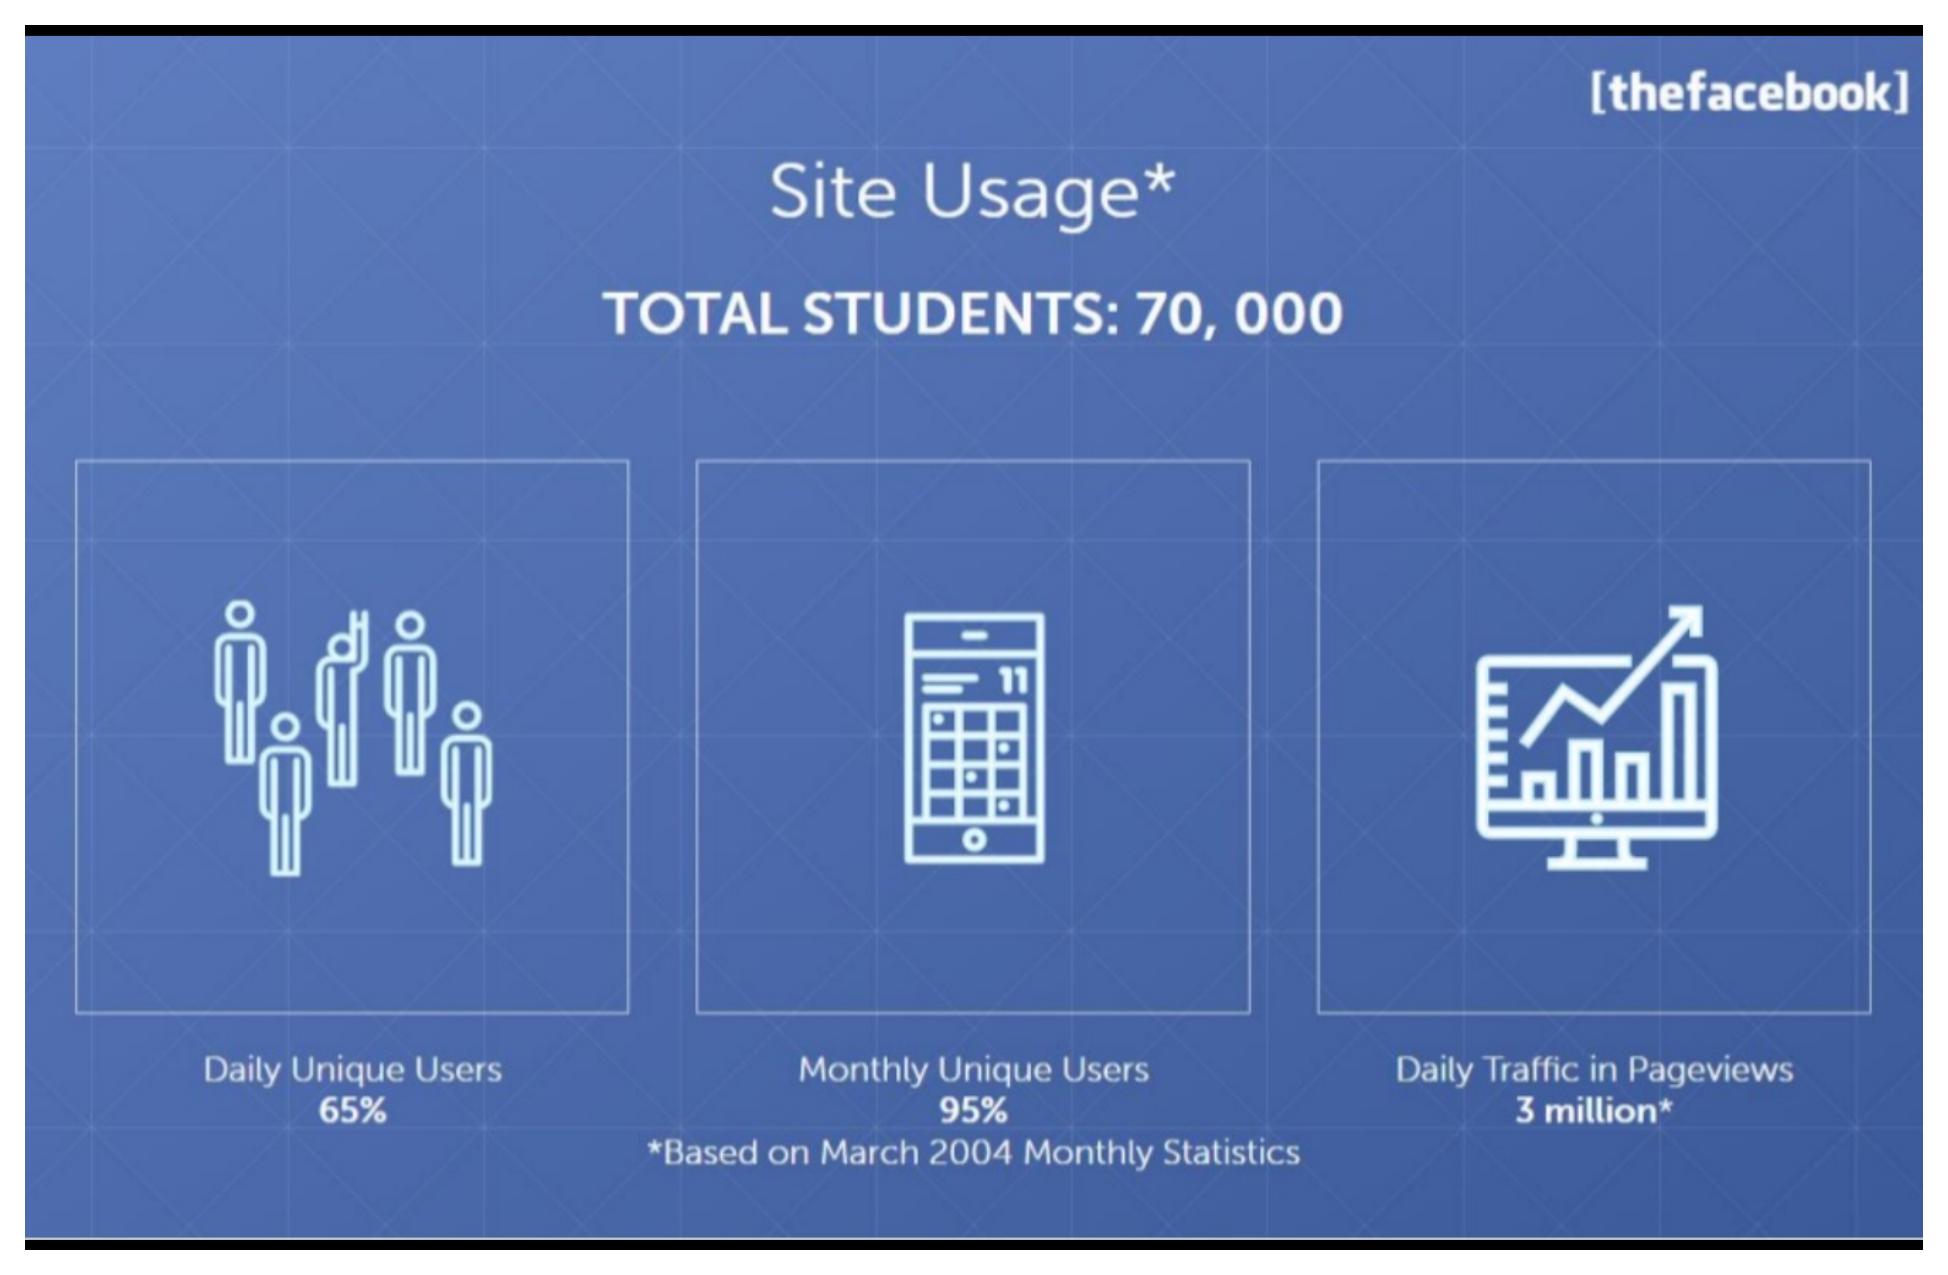
The killer engagement slide. DAU/MAU ratios that would make any consumer investor lean in. Pageviews translate habit into inventory for banner ads.
90 million monthly pageviews with upward user icons (*March 2004 monthly statistics).
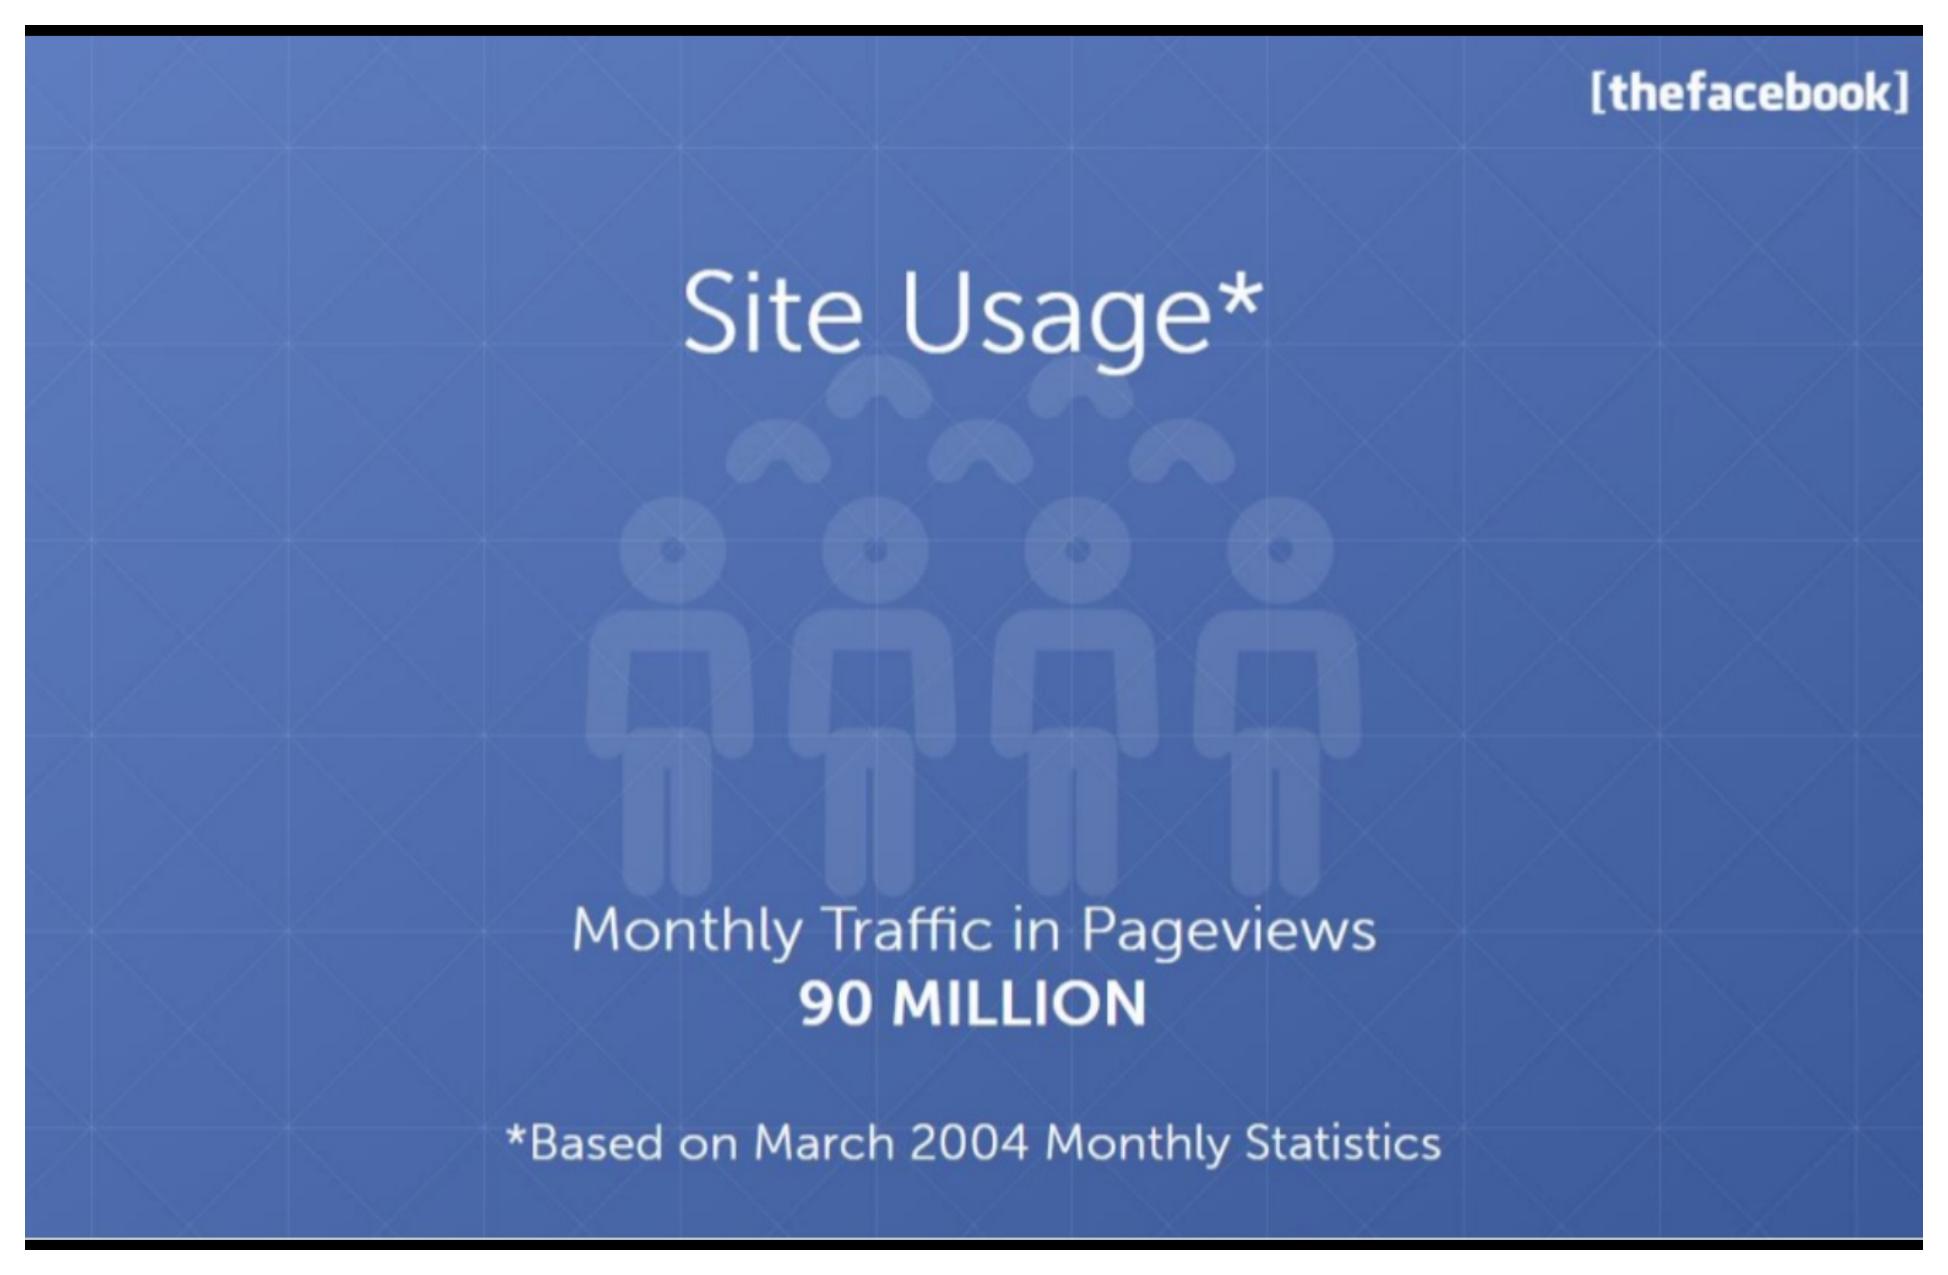
Isolates scale on its own slide so the number lands. 90M monthly views from 70K users implies extreme session depth, not passive sign-ups.
The Daily Pennsylvanian (03/25/04): "I have a new addiction. It is powerful. It is disturbing. It is thefacebook.com."
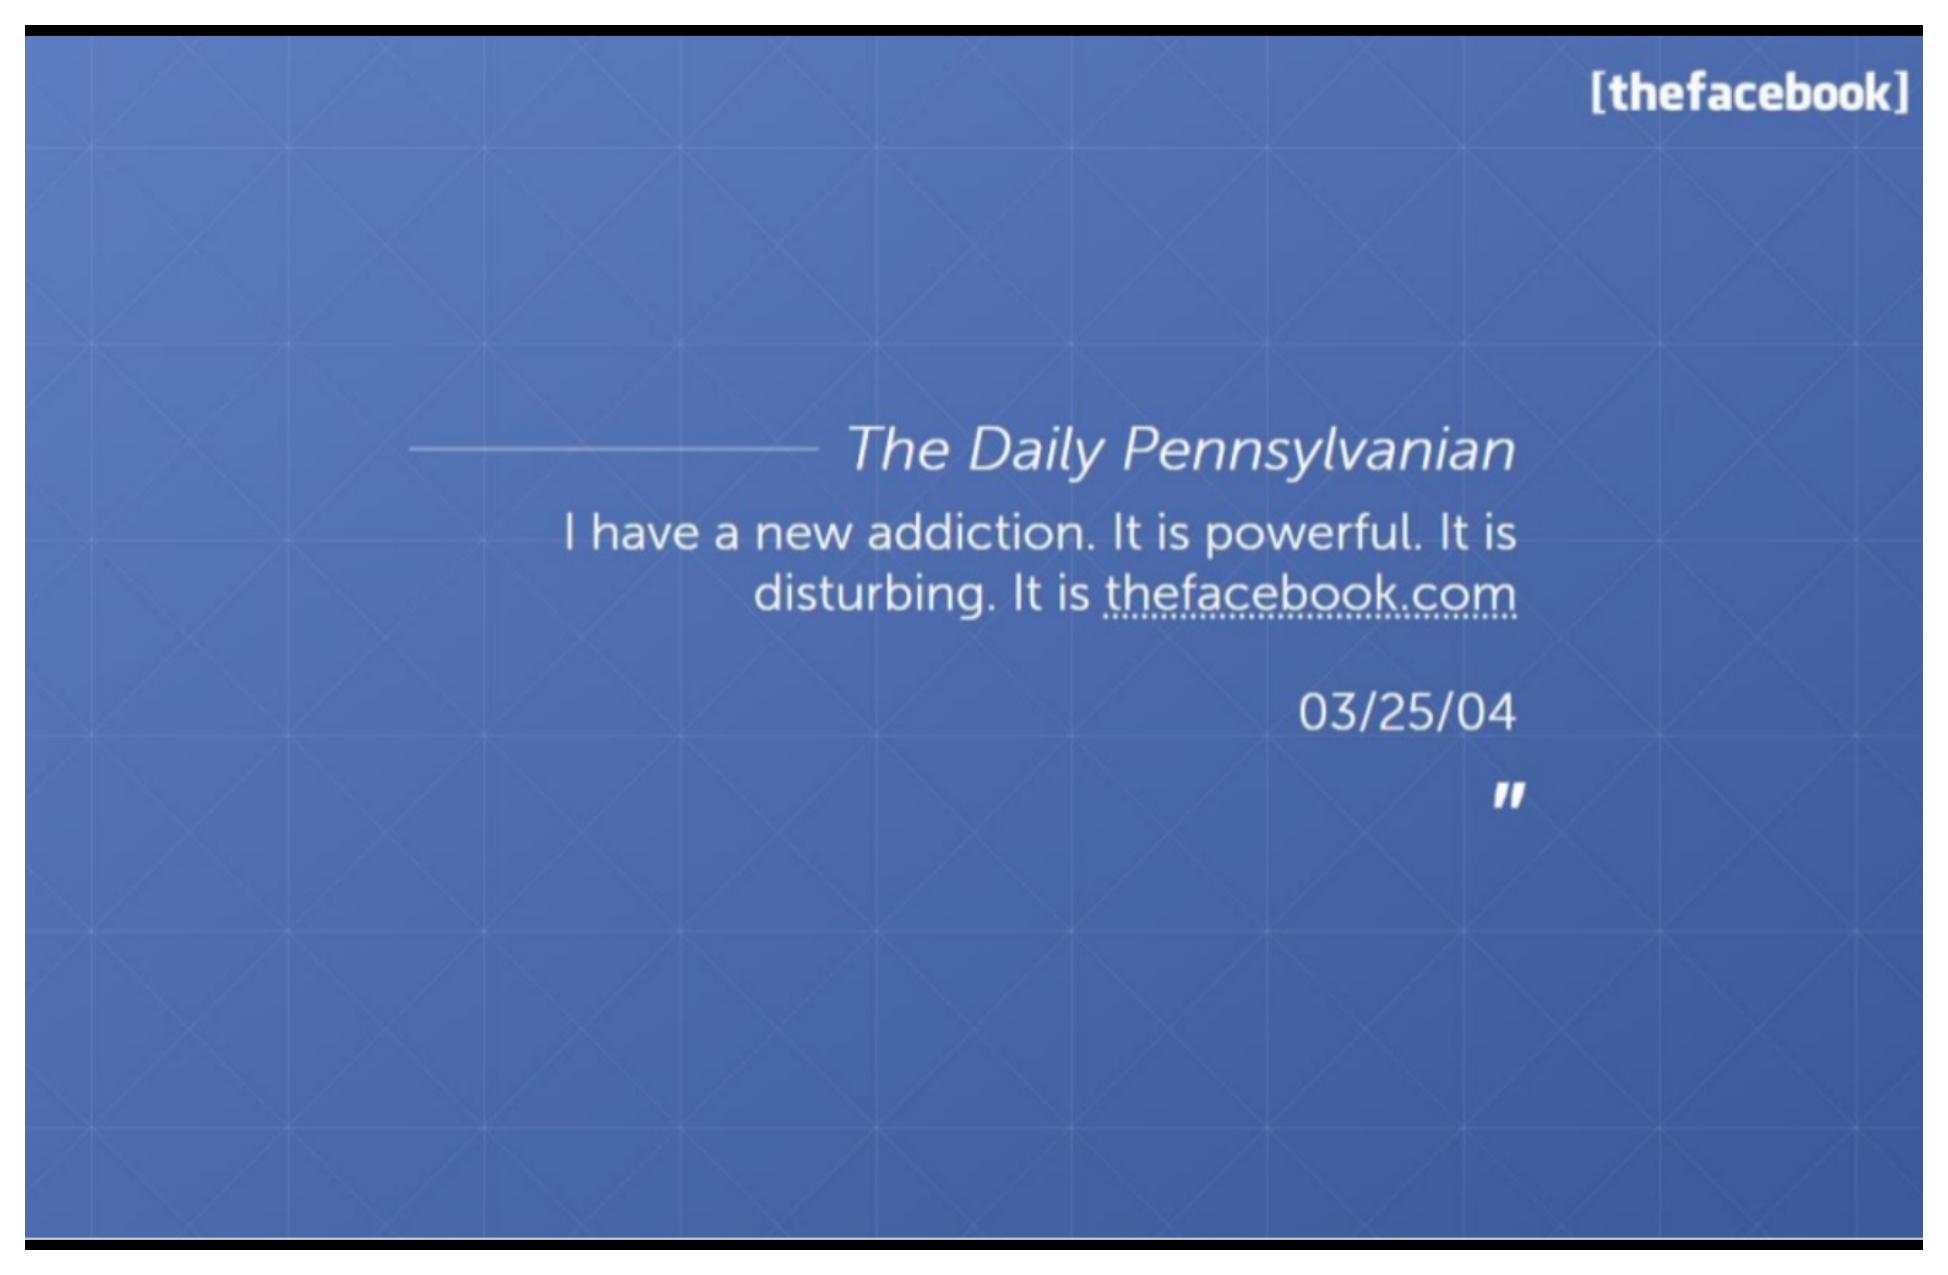
Mid-deck social proof refreshes attention after the metrics block, a second campus paper calling usage an "addiction" reinforces the opening Stanford quote.
Accelerating user growth including 10,000 new members in the first week of April 2004; rising daily unique share and pageviews tracking user growth.
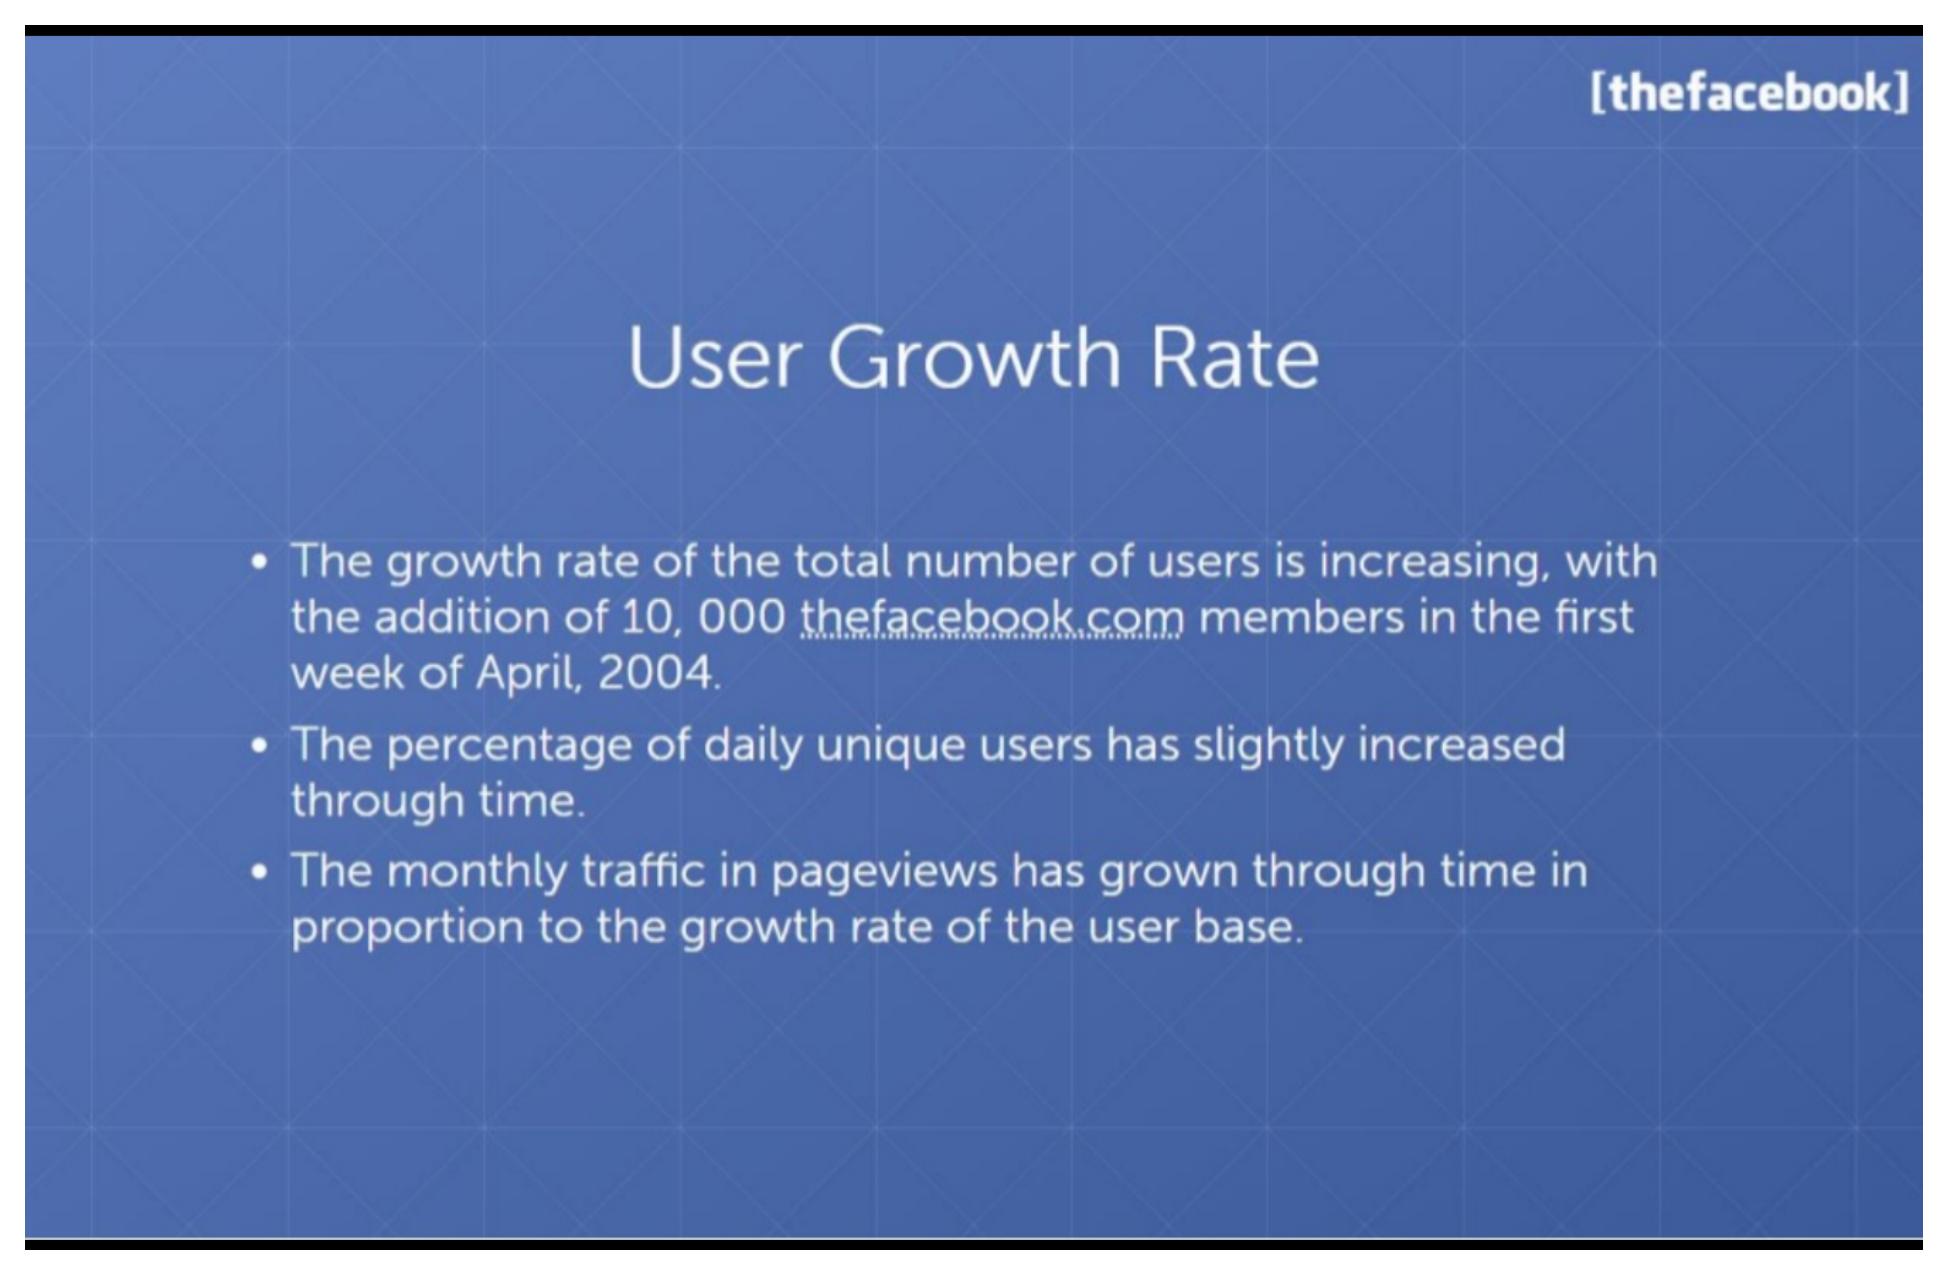
Growth narrative in words when charts might lag, ties recent weekly adds to engagement trends so momentum feels current, not frozen in March stats.
Section divider introducing online marketing services with easel icon on blue grid.
Clear pivot from product traction to monetization, advertisers know the proof phase ended and the sales pitch begins.
Reach students, alumni, faculty, and staff at library, work, home, or dorm via banners, links, and contextual placements, with help optimizing campaign goals.
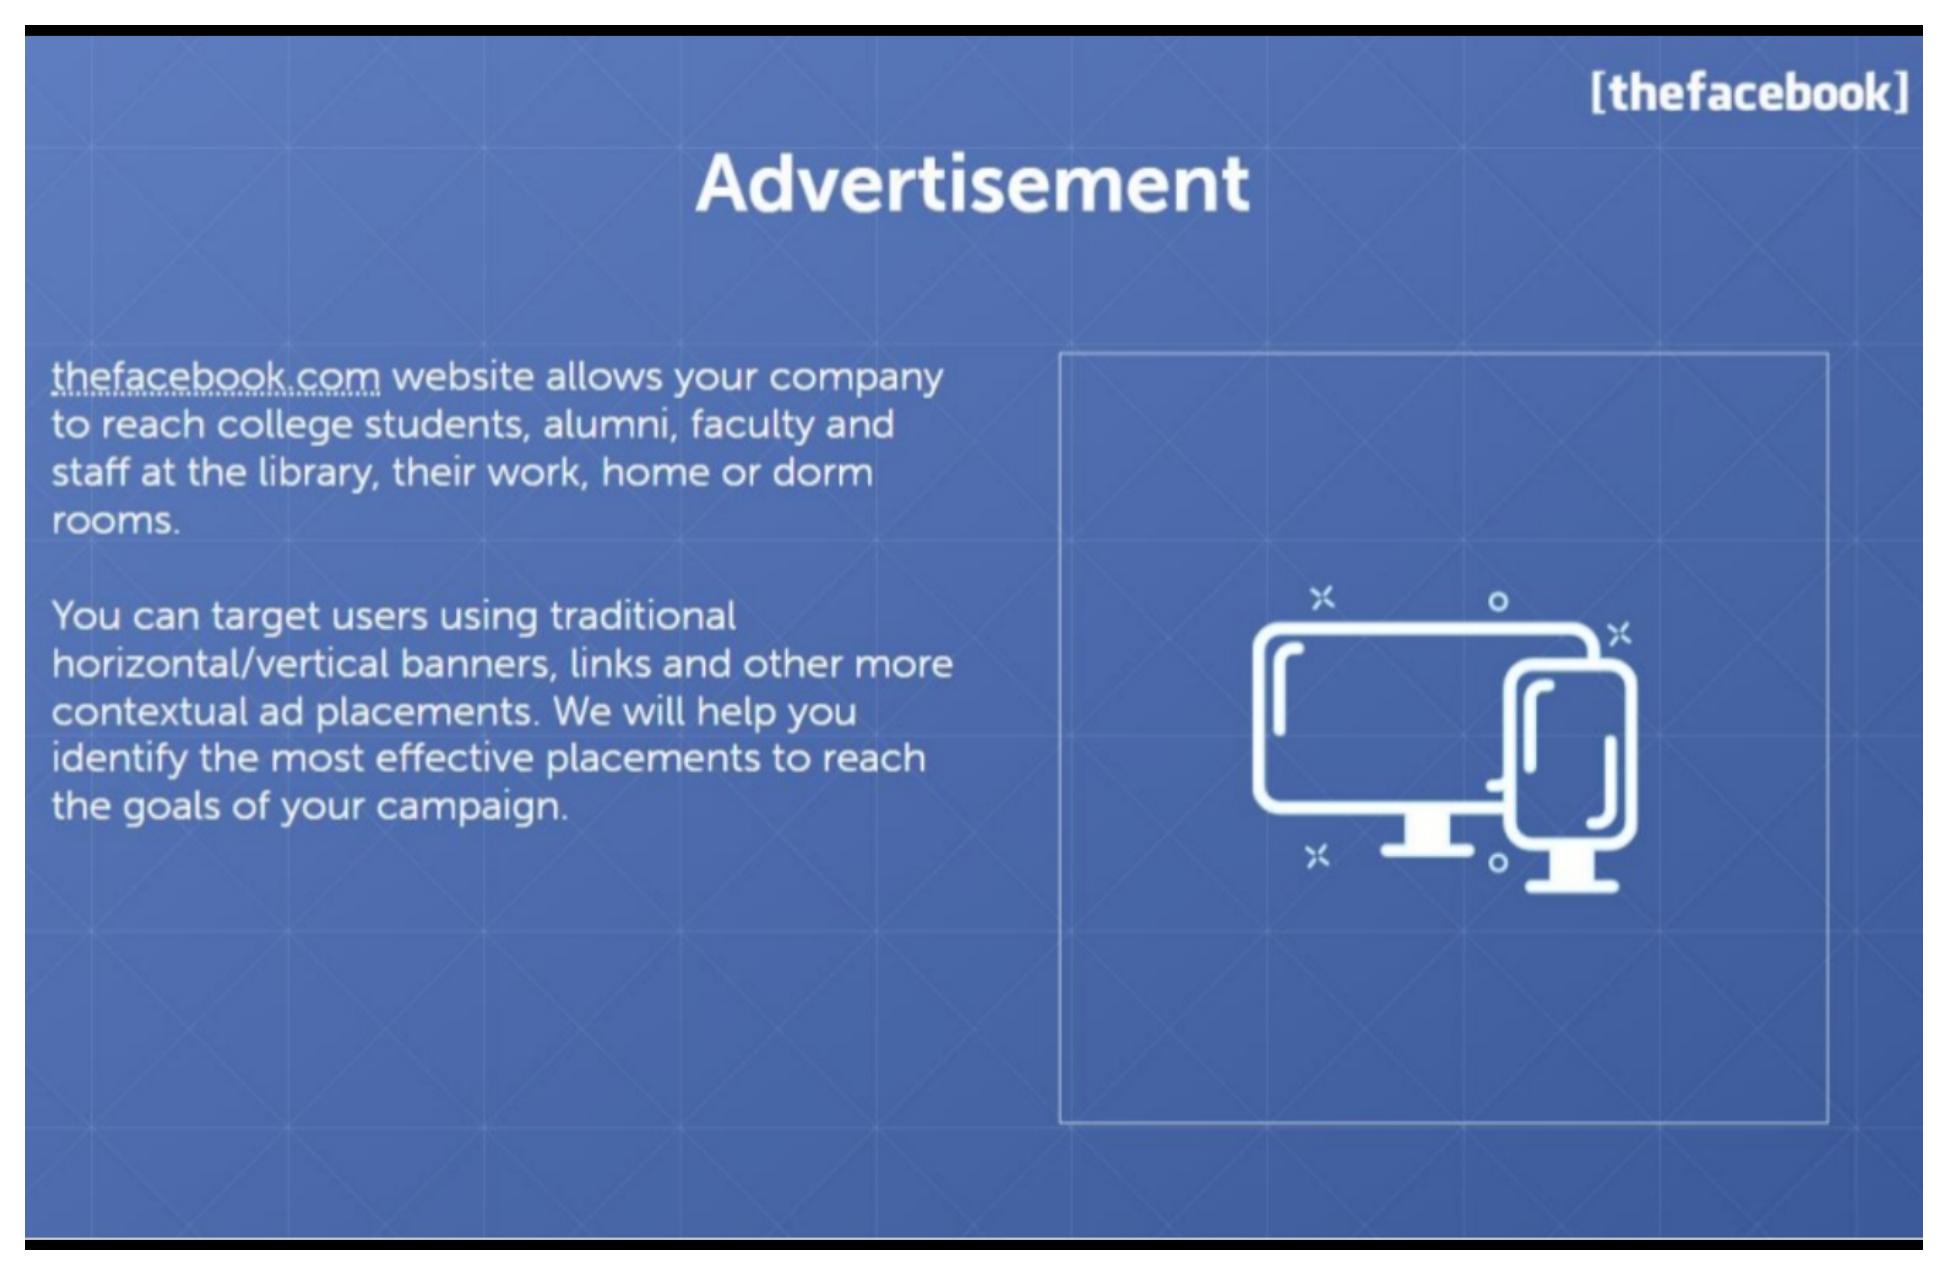
Value prop for brands is access and targeting assistance, not CPM jargon yet. Positions thefacebook as a channel into campus life across devices.
Seventeen targeting parameters: school, degree, concentration, courses, class year, dorm, age, gender, orientation, hometown, interests, clubs, politics, friend counts, and site usage.
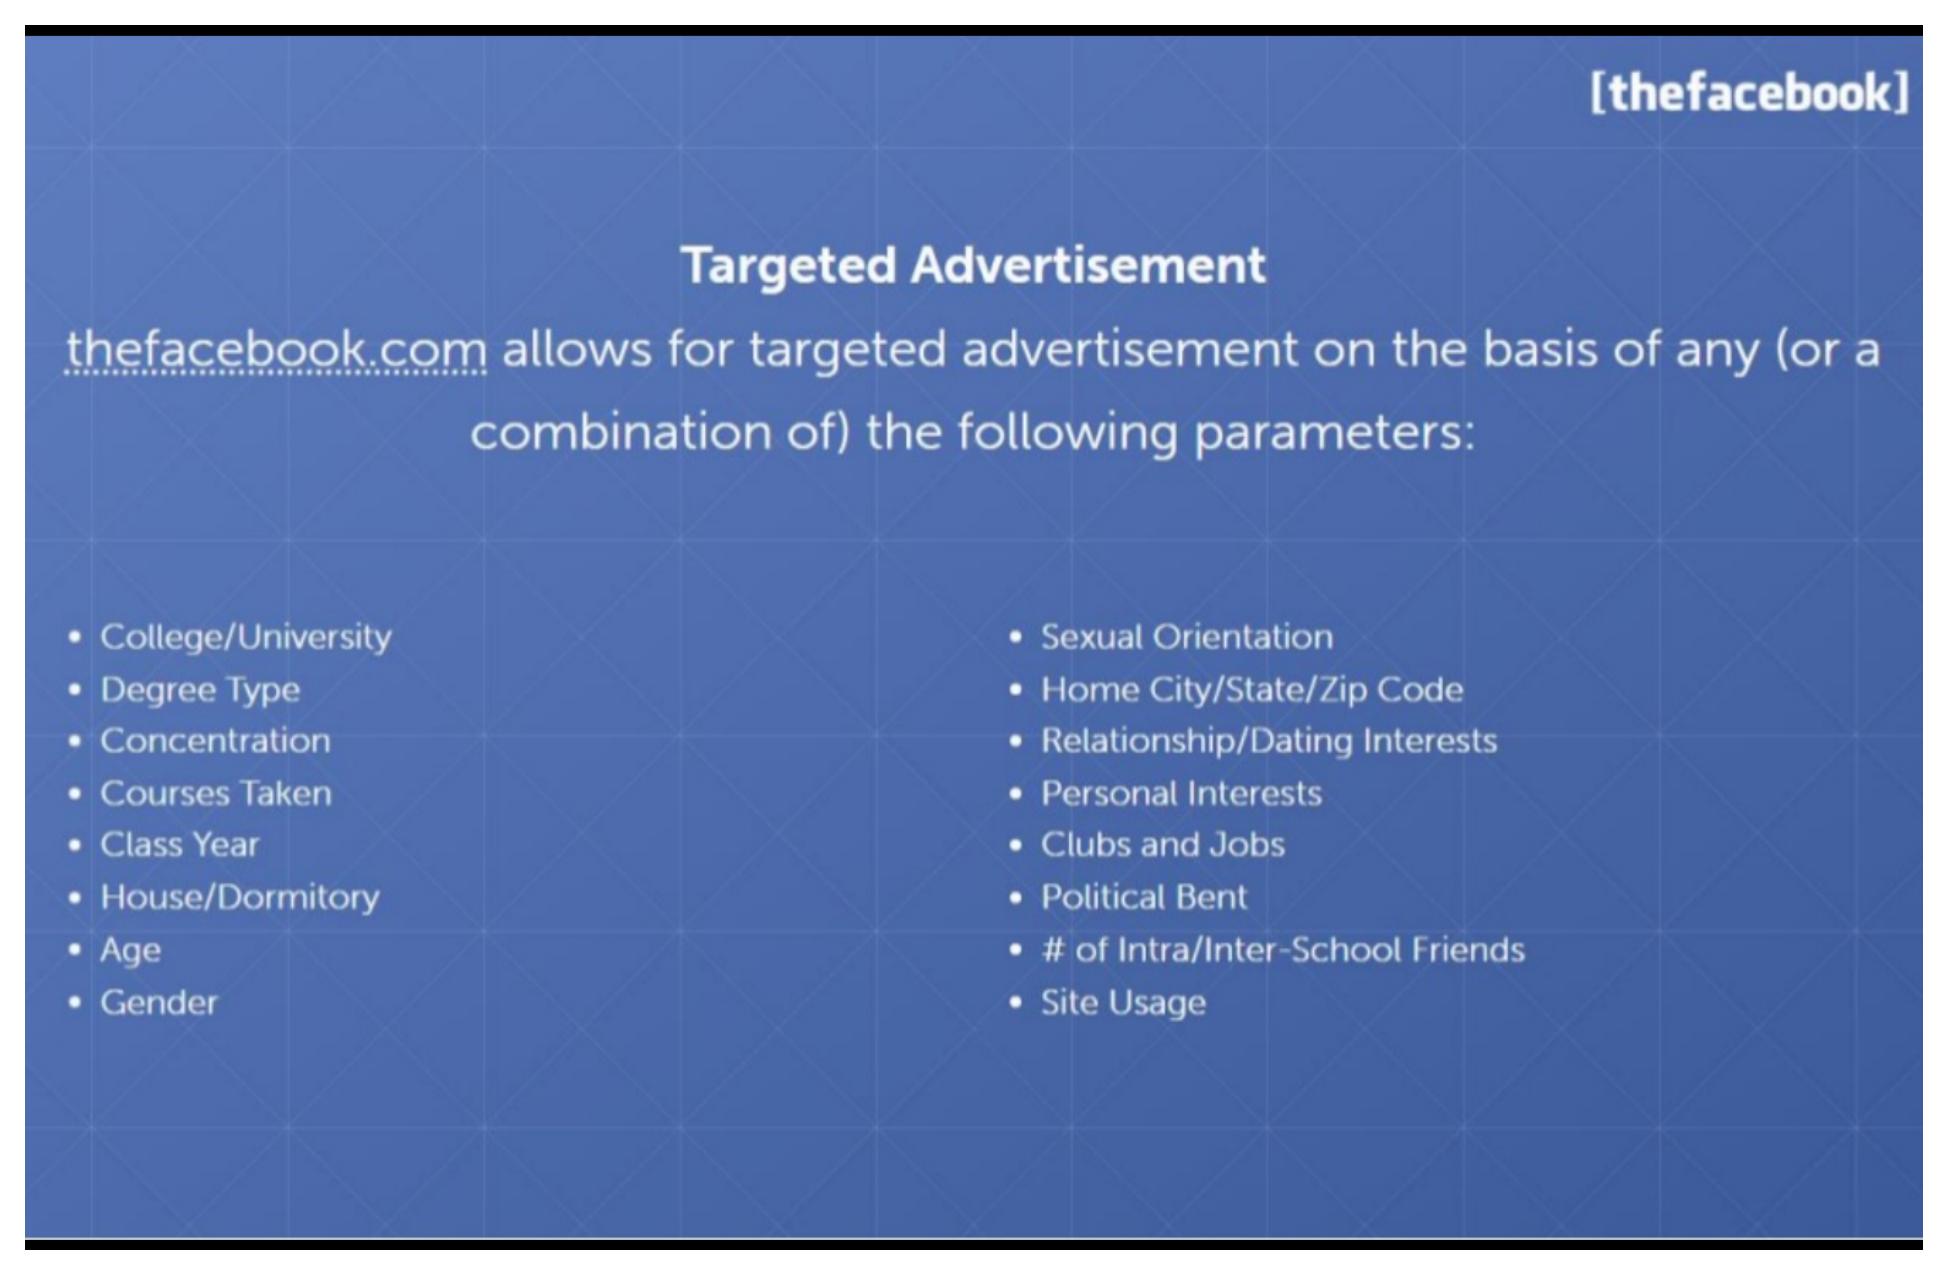
The moat slide for ad revenue, rich profile data enables precision no newspaper could match. Lists concrete fields so media buyers see immediate use cases.
Banner rates vary by scope, duration, and targeting; standard IAB sizes 468×60, 120×240, 120×90, 125×125; link rates vary by targeting, contact for rate card.
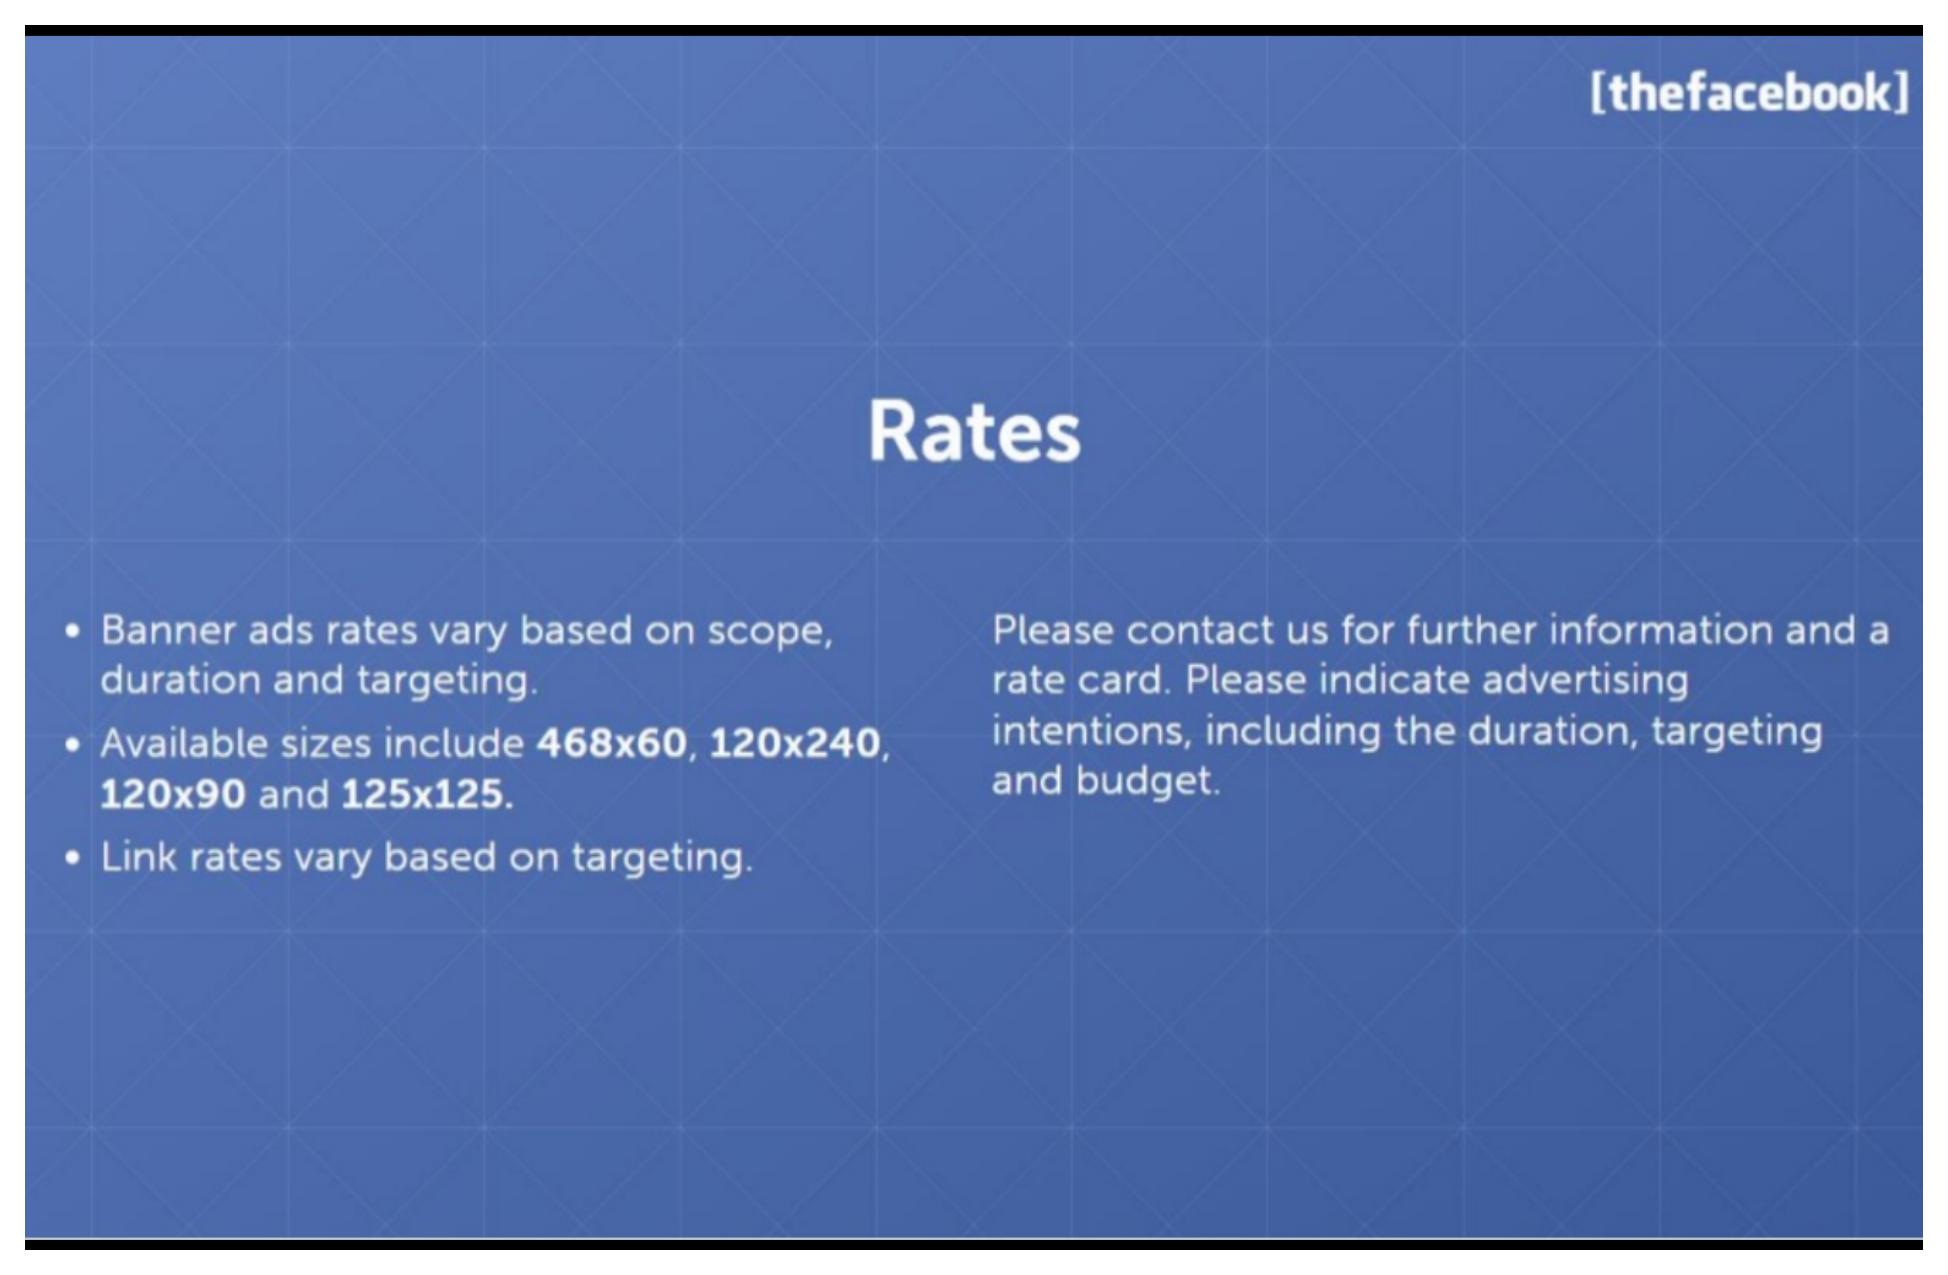
Keeps pricing opaque but proves a real ad product existed, sizes and variables signal professionalism without committing numbers on-slide.
Email Eduardo Saverin, CFO, Thefacebook.com in Cambridge, to expose products, services, or recruiting to thousands nationwide.
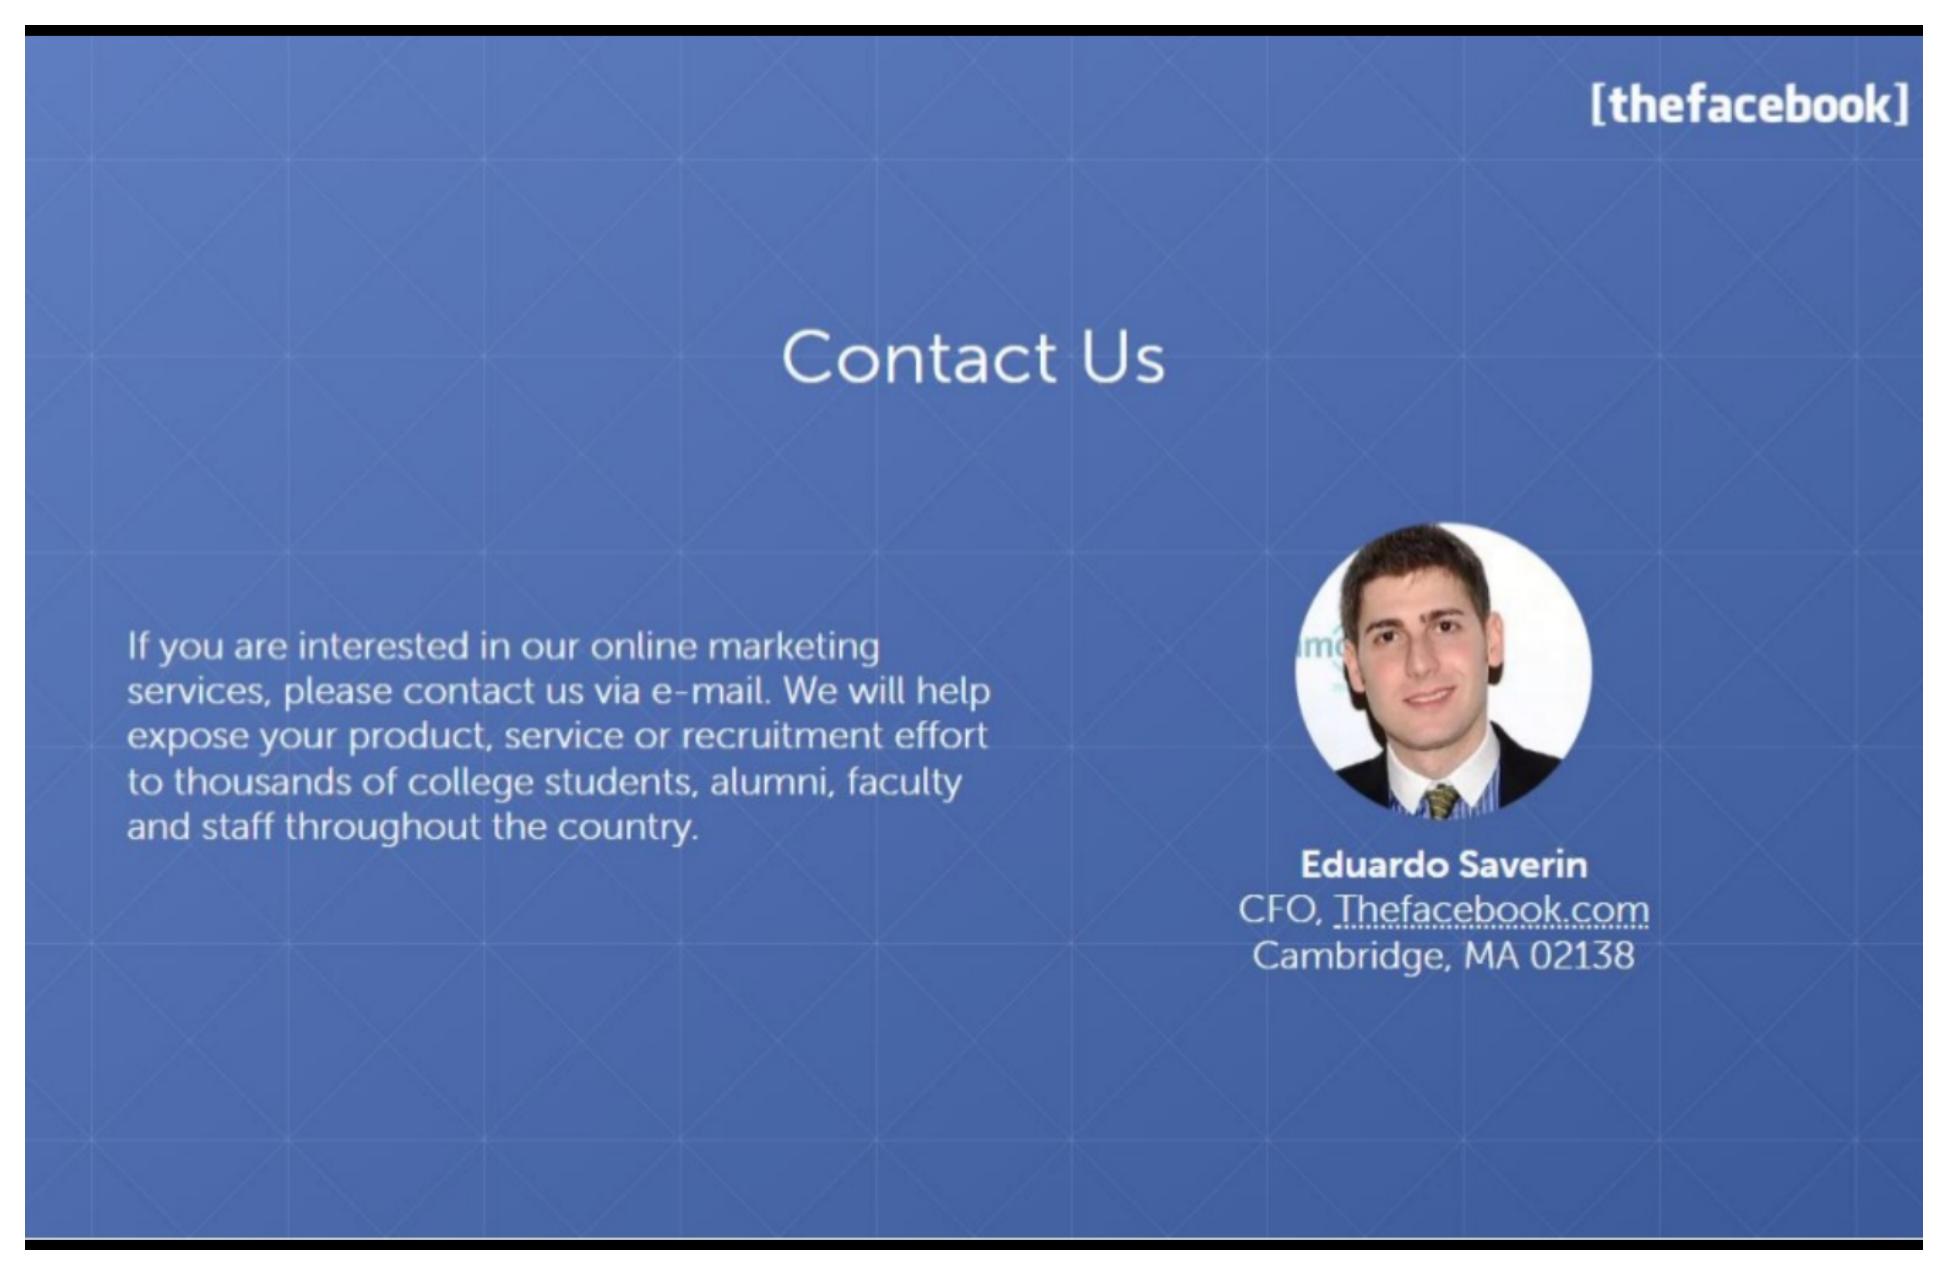
Human close with a named CFO and photo, rare in dorm-room decks. Makes the kit actionable for advertisers ready to buy, not just admire metrics.
The Harvard Independent (03/04/04): Facebook connects people through courses, interests, houses, politics, concentration, and favorite movies.
Bookends the deck with campus press like slide three, ends on product breadth (many connection vectors), not another chart. Narrative closure investors remember.
Join 100,000+ professionals creating presentations worth presenting.
Eduardo Saverin built this Spring 2004 media kit to sell online advertising on thefacebook.com, not a classic VC deck, but the document Peter Thiel saw before investing $500K that summer. Two months after launch, the kit already shows 70,000 student users, 3 million daily pageviews, and expansion across every Ivy League school plus Stanford, MIT, and Berkeley. Note the campus-by-campus rollout proof, engagement metrics that precede revenue, and press quotes that bookend the story.

Original 2004 deck · 26 slides. Click a thumbnail or scroll down for the full breakdown.
Cover reads "Facebook's original pitch deck" with a MEDIA KIT subtitle and Spring 2004 date on branded blue grid.

Frames the document as a sales kit for advertisers, not a fundraising memo, a format Saverin could hand to brands while the product was still pre-revenue.
Table of contents listing cover, opening quote, solution, product, validation, vision, demographics, engagement, growth, services, contact, and closing quote.

Unusual in investor decks but smart for a media kit, advertisers get a roadmap before the pitch. Shows the narrative arc was planned, not improvised.
The Stanford Daily (03/05/2004): classes skipped, work ignored, students glued to thefacebook.com. "the craze has swept through campus."

Opens with earned media, not a mission statement. The quote proves product-market fit at an elite school before any user chart appears.
An expanding online directory connecting students, alumni, faculty, and staff through school social networks, with friendship, course, and inter-school links plus built-in messaging.

One paragraph defines the category, directory plus social graph, without feature sprawl. Investors and advertisers grasp the model in under ten seconds.
Profiles include contact info, personal details (relationship status, politics, clubs, favorites), auto-built course schedules, and a photo, with a screenshot of Sean Parker's Harvard profile.

Real product UI on slide five, not mockups. The course database and class schedule automation show domain-specific depth competitors like Friendster lacked.
Profiles auto-link to school news mentioning the user, show last AIM away messages, and last dorm access location via a built-in housing database.

Campus-native integrations (AIM, dorm halls, student papers) make the product feel indispensable to college life, sticky behavior investors could underwrite even without ads yet.
Within-school browsing via Social Net (ten random classmates), Course Rosters, and advanced profile search; verified friend lists with network visualization and friend-of-friend indicators.

Names three discovery loops that drive daily return visits. Friendship verification and graph visualization were early network-effect mechanics, not cosmetic features.
Global search lets users browse other schools' networks and maintain separate friendship lists per campus in thefacebook.com network.

Shows cross-campus reach before national expansion, the product was multi-school from the start, which made the "200 schools by September" goal believable.
Launched February 4, 2004 at Harvard; by April 10 the network lists member schools with launch dates to follow.

Transition slide sets up traction tables, gives readers context before a wall of school names. Dates prove velocity, not just presence.
Launch dates from Harvard (Feb 4) through Princeton and Brown (Apr 4) for all eight Ivy League universities.

Prestige schools as a wedge. 55% of users would come from Ivy League per later slides. Investors see exclusive, dense campuses conquered in eight weeks.
Stanford, MIT, NYU, BU, UC Berkeley, Duke, Georgetown, UVA, Tufts, Boston College, Northeastern, and Illinois, launches from February through April 2004.

Splits Ivy and non-Ivy tables so the list stays scannable. Proves the playbook works beyond the East Coast elite bubble.
Mission to include most U.S, colleges; target of more than 200 member schools by September 1, 2004.

Specific deadline plus numeric goal, investors and advertisers can hold the team accountable. Ambition is stated as a rollout plan, not TAM hand-waving.
15 million U.S, college students with $85B+ purchasing power. $21B on food, $9B on autos, $5B on clothes, $4B on phones, plus active job seekers.

Market size for advertisers, not VCs, ties eyeballs to wallet size. The "college addiction" framing matches the opening press quote narrative.
70,000 total students, pie chart split 55% Ivy-League schools vs 45% other schools (*March 2004 stats).

First of three demographic slides; school mix shows premium density without ignoring broader rollout. Footnote dates the data so numbers feel audited, not inflated.
Same 70,000 student base. 87% students, 11% alumni, 2% faculty-staff (*March 2004).

Role breakdown confirms the core user is still enrolled, alumni share hints at lifecycle value without diluting the student-focused ad pitch.
Gender split 48% men / 52% women; 92% aged 18–24, with playful restroom and keg-stand icons (*March 2004).

Demographics advertisers care about, gender balance and age band, delivered with campus humor that matches the brand tone without hiding the data.
65% daily unique users, 95% monthly unique users, and 3 million daily pageviews among 70,000 students (*March 2004).

The killer engagement slide. DAU/MAU ratios that would make any consumer investor lean in. Pageviews translate habit into inventory for banner ads.
90 million monthly pageviews with upward user icons (*March 2004 monthly statistics).

Isolates scale on its own slide so the number lands. 90M monthly views from 70K users implies extreme session depth, not passive sign-ups.
The Daily Pennsylvanian (03/25/04): "I have a new addiction. It is powerful. It is disturbing. It is thefacebook.com."

Mid-deck social proof refreshes attention after the metrics block, a second campus paper calling usage an "addiction" reinforces the opening Stanford quote.
Accelerating user growth including 10,000 new members in the first week of April 2004; rising daily unique share and pageviews tracking user growth.

Growth narrative in words when charts might lag, ties recent weekly adds to engagement trends so momentum feels current, not frozen in March stats.
Section divider introducing online marketing services with easel icon on blue grid.

Clear pivot from product traction to monetization, advertisers know the proof phase ended and the sales pitch begins.
Reach students, alumni, faculty, and staff at library, work, home, or dorm via banners, links, and contextual placements, with help optimizing campaign goals.

Value prop for brands is access and targeting assistance, not CPM jargon yet. Positions thefacebook as a channel into campus life across devices.
Seventeen targeting parameters: school, degree, concentration, courses, class year, dorm, age, gender, orientation, hometown, interests, clubs, politics, friend counts, and site usage.

The moat slide for ad revenue, rich profile data enables precision no newspaper could match. Lists concrete fields so media buyers see immediate use cases.
Banner rates vary by scope, duration, and targeting; standard IAB sizes 468×60, 120×240, 120×90, 125×125; link rates vary by targeting, contact for rate card.

Keeps pricing opaque but proves a real ad product existed, sizes and variables signal professionalism without committing numbers on-slide.
Email Eduardo Saverin, CFO, Thefacebook.com in Cambridge, to expose products, services, or recruiting to thousands nationwide.

Human close with a named CFO and photo, rare in dorm-room decks. Makes the kit actionable for advertisers ready to buy, not just admire metrics.
The Harvard Independent (03/04/04): Facebook connects people through courses, interests, houses, politics, concentration, and favorite movies.

Bookends the deck with campus press like slide three, ends on product breadth (many connection vectors), not another chart. Narrative closure investors remember.
Join 100,000+ professionals creating presentations worth presenting.